HOT TOPICS LIST
- MACD
- Fibonacci
- RSI
- Gann
- ADXR
- Stochastics
- Volume
- Triangles
- Futures
- Cycles
- Volatility
- ZIGZAG
- MESA
- Retracement
- Aroon
INDICATORS LIST
LIST OF TOPICS
PRINT THIS ARTICLE
by Donald W. Pendergast, Jr.
Any questions about a new bear market seem kind of moot right about now. One of the most bearish sectors of all is energy, and here's a glance at the current chart of a major oil services outfit.
Position: Sell
Donald W. Pendergast, Jr.
Donald W. Pendergast is a financial markets consultant who offers specialized services to stock brokers and high net worth individuals who seek a better bottom line for their portfolios.
PRINT THIS ARTICLE
SUPPORT & RESISTANCE
Rowan Cos. Takes A Big Hit
08/05/11 08:40:30 AMby Donald W. Pendergast, Jr.
Any questions about a new bear market seem kind of moot right about now. One of the most bearish sectors of all is energy, and here's a glance at the current chart of a major oil services outfit.
Position: Sell
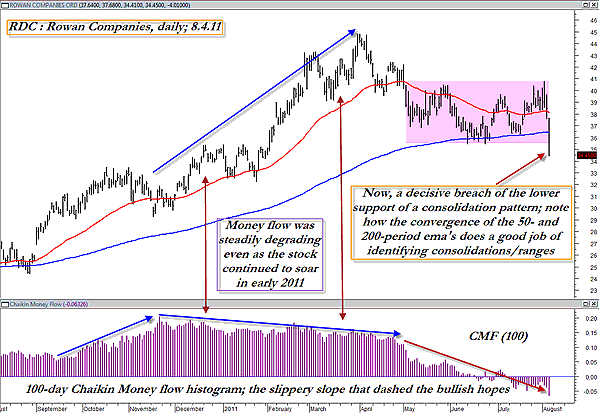
| Figure 1, a daily chart of Rowan Companies (RDC), displays a near-textbook quality bearish price/money flow divergence pattern, one that clearly was warning investors and traders that a selloff (timing unknown) was likely due for the stock. Note how the stock made an initial surge higher after the spring/summer 2010 selloff, complete with a steadily rising long-term money flow histogram. That was a sign of a healthy stock, one attracting lots of new fuel (trading volume) even as it gained in value. Then came a normal retracement to the 50-period exponential moving average (EMA) line, after which a secondary surge higher commenced. This time, however, the money flow trend was failing to keep up with the ever-increasing value of the stock, giving astute investors and traders an early warning that the lifespan of that particular swing move was due to have a significant correction at some point -- and probably sooner rather than later. RDC eventually peaked out in April 2011 and soon after went into a three-month long period of consolidation (pink shaded area). During that time, the 50- and the 200-day EMAs slowly began to flatten/converge before Thursday's shock selloff sent a message that RDC was getting ready to head out of Dodge on the first southbound express train. And did it ever head south in a hurry, losing about 10% of its value just since the end of Wednesday's trading session. |

|
| FIGURE 1: RDC, DAILY. When a negative price/money flow divergence becomes pronounced, wise traders and investors will want to adjust their individual stock holdings and/or trading strategies accordingly to take advantage of the emerging market dynamics in such stocks. |
| Graphic provided by: MetaStock. |
| |
| While it would be foolish to attempt to predict a price target for RDC in the next few weeks, it's still pretty easy to see that the stock is under heavy selling pressure and that a "Sell the intraday rallies" kind of trading mindset is probably a better choice than the "Let's buy the dips and average down" kind of thinking. That daily chart of the .SPX (not shown) is downright scary, bringing back ugly memories of the 2000-02 and 2007-09 market debacles, and it would be foolish to expect this market to turn around on the proverbial dime any time soon. Bottom line: Look to short intraday rallies back to resistance levels and take profits by the end of the day so you don't get squashed in any upcoming short-covering rallies. In the market as in life, it's always better to be safe than sorry. |
Donald W. Pendergast is a financial markets consultant who offers specialized services to stock brokers and high net worth individuals who seek a better bottom line for their portfolios.
| Title: | Writer, market consultant |
| Company: | Linear Trading Systems LLC |
| Jacksonville, FL 32217 | |
| Phone # for sales: | 904-239-9564 |
| E-mail address: | lineartradingsys@gmail.com |
Traders' Resource Links | |
| Linear Trading Systems LLC has not added any product or service information to TRADERS' RESOURCE. | |
Click here for more information about our publications!
Comments
Date: 08/07/11Rank: 3Comment:

Request Information From Our Sponsors
- StockCharts.com, Inc.
- Candle Patterns
- Candlestick Charting Explained
- Intermarket Technical Analysis
- John Murphy on Chart Analysis
- John Murphy's Chart Pattern Recognition
- John Murphy's Market Message
- MurphyExplainsMarketAnalysis-Intermarket Analysis
- MurphyExplainsMarketAnalysis-Visual Analysis
- StockCharts.com
- Technical Analysis of the Financial Markets
- The Visual Investor
- VectorVest, Inc.
- Executive Premier Workshop
- One-Day Options Course
- OptionsPro
- Retirement Income Workshop
- Sure-Fire Trading Systems (VectorVest, Inc.)
- Trading as a Business Workshop
- VectorVest 7 EOD
- VectorVest 7 RealTime/IntraDay
- VectorVest AutoTester
- VectorVest Educational Services
- VectorVest OnLine
- VectorVest Options Analyzer
- VectorVest ProGraphics v6.0
- VectorVest ProTrader 7
- VectorVest RealTime Derby Tool
- VectorVest Simulator
- VectorVest Variator
- VectorVest Watchdog
