HOT TOPICS LIST
- MACD
- Fibonacci
- RSI
- Gann
- ADXR
- Stochastics
- Volume
- Triangles
- Futures
- Cycles
- Volatility
- ZIGZAG
- MESA
- Retracement
- Aroon
INDICATORS LIST
LIST OF TOPICS
PRINT THIS ARTICLE
by Mike Carr, CMT
While gold trading hasn't reached a bubbly high, it could be time for a pullback.
Position: Hold
Mike Carr, CMT
Mike Carr, CMT, is a member of the Market Technicians Association, and editor of the MTA's newsletter, Technically Speaking. He is also the author of "Smarter Investing in Any Economy: The Definitive Guide to Relative Strength Investing," and "Conquering the Divide: How to Use Economic Indicators to Catch Stock Market Trends."
PRINT THIS ARTICLE
RATE OF CHANGE
Gold Isn't In A Bubble, But It Is Overbought
08/04/11 09:12:22 AMby Mike Carr, CMT
While gold trading hasn't reached a bubbly high, it could be time for a pullback.
Position: Hold
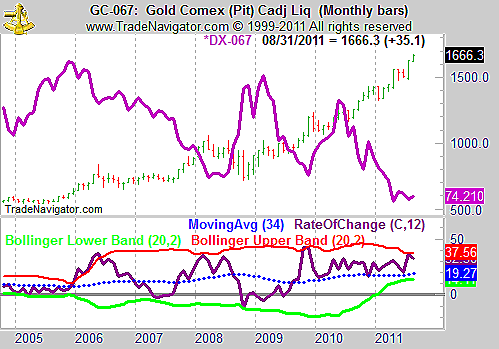
| Multiple time frame analysis is a useful technical tool. It seems most useful to work from the highest to the lowest time frame and apply a consistent template within each time frame. Looking at gold, the monthly chart (Figure 1) shows a rapid rise, but not a bubble. To be considered a bubble, I look for the annual rate of change (ROC) to exceed 40%. We are close, with ROC near 38%, but the ROC is still within the Bollinger Bands, which also offer a signal when a bubble is under way. The ROC usually goes above the upper band in a bubble. |

|
| FIGURE 1: GOLD, MONTHLY. Monthly gold prices show that there is some degree of correlation between gold and the dollar, but it shifts with time. |
| Graphic provided by: Trade Navigator. |
| |
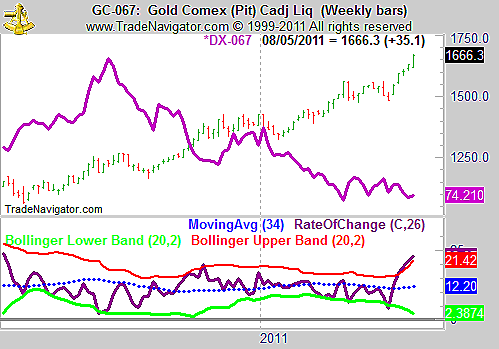
| The weekly chart (Figure 2) shows that gold has gotten overbought. The ROC has gone above the upper Bollinger Band, and a break below that line would indicate a sell signal. |

|
| FIGURE 2: GOLD, WEEKLY. Weekly gold prices show a strongly trending bull market. |
| Graphic provided by: Trade Navigator. |
| |
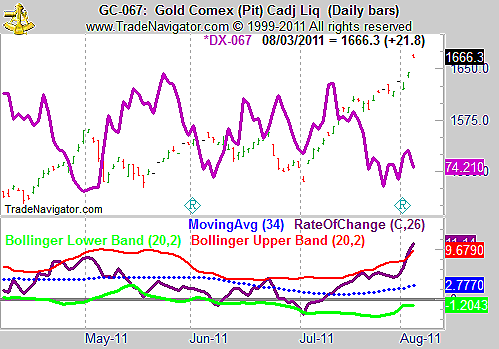
| Timing signals are often obtained from a daily chart, which is shown in Figure 3. Here we also see an overbought market, and the unreliability of the correlation with the dollar. Intermarket relationships seldom last in trading, and the price of gold will offer the best signals for those trading gold. A move toward 1600 would represent a pullback into the recent short-term consolidation. This is supported by the lack of a bubble in the commodity. Moves that go too far, too fast are usually quickly reversed. That does not appear to be the case in gold. |

|
| FIGURE 3: GOLD, DAILY. The gap on August 3 could be an exhaustion gap. |
| Graphic provided by: Trade Navigator. |
| |
| Long-term traders looking to buy gold may not have missed the entire bull move. The daily chart shows an extended uptrend, but the higher time frames show no sign of a bubble top. A pullback from current levels would present a good entry on the long side. |
Mike Carr, CMT, is a member of the Market Technicians Association, and editor of the MTA's newsletter, Technically Speaking. He is also the author of "Smarter Investing in Any Economy: The Definitive Guide to Relative Strength Investing," and "Conquering the Divide: How to Use Economic Indicators to Catch Stock Market Trends."
| Website: | www.moneynews.com/blogs/MichaelCarr/id-73 |
| E-mail address: | marketstrategist@gmail.com |
Click here for more information about our publications!
PRINT THIS ARTICLE

Request Information From Our Sponsors
- StockCharts.com, Inc.
- Candle Patterns
- Candlestick Charting Explained
- Intermarket Technical Analysis
- John Murphy on Chart Analysis
- John Murphy's Chart Pattern Recognition
- John Murphy's Market Message
- MurphyExplainsMarketAnalysis-Intermarket Analysis
- MurphyExplainsMarketAnalysis-Visual Analysis
- StockCharts.com
- Technical Analysis of the Financial Markets
- The Visual Investor
- VectorVest, Inc.
- Executive Premier Workshop
- One-Day Options Course
- OptionsPro
- Retirement Income Workshop
- Sure-Fire Trading Systems (VectorVest, Inc.)
- Trading as a Business Workshop
- VectorVest 7 EOD
- VectorVest 7 RealTime/IntraDay
- VectorVest AutoTester
- VectorVest Educational Services
- VectorVest OnLine
- VectorVest Options Analyzer
- VectorVest ProGraphics v6.0
- VectorVest ProTrader 7
- VectorVest RealTime Derby Tool
- VectorVest Simulator
- VectorVest Variator
- VectorVest Watchdog
