HOT TOPICS LIST
- MACD
- Fibonacci
- RSI
- Gann
- ADXR
- Stochastics
- Volume
- Triangles
- Futures
- Cycles
- Volatility
- ZIGZAG
- MESA
- Retracement
- Aroon
INDICATORS LIST
LIST OF TOPICS
PRINT THIS ARTICLE
by Chaitali Mohile
The long-term bullish breakout is at the middle of its journey. The price actions and indicators signify steady rally toward the target.
Position: N/A
Chaitali Mohile
Active trader in the Indian stock markets since 2003 and a full-time writer. Trading is largely based upon technical analysis.
PRINT THIS ARTICLE
BREAKOUTS
IBM Remains Healthily Bullish
08/03/11 10:22:09 AMby Chaitali Mohile
The long-term bullish breakout is at the middle of its journey. The price actions and indicators signify steady rally toward the target.
Position: N/A
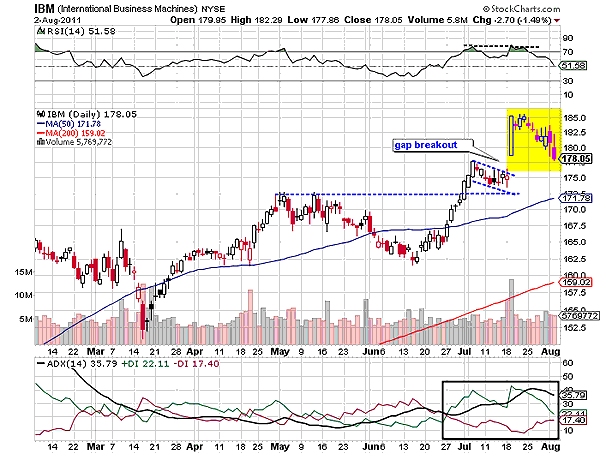
| An advance rally of IBM violated an intermediate resistance at $171 levels in June 2011. The three long bullish candles reversed a weak trend to an uptrend in Figure 1. The uptrend continued to surge but price turned sideways, challenging the newly formed support at $171 levels. The consolidation formed a bullish flag & pennant formation that broke upward with a small gap. The yellow block in Figure 1 shows the long white candle, indicating the strength of the bullish breakout. The single session gained almost $5 during the breakout. Since the relative strength index (RSI) (14) formed a double top, a bearish reversal formation, on the daily chart, IBM turned volatile at the new high of $185. We can see the small doji candlesticks and the red/white candles with long upper shadows in the yellow block. Gradually, the stock began losing its previous intraday gains. |

|
| FIGURE 1: IBM, DAILY |
| Graphic provided by: StockCharts.com. |
| |
| Currently, the stock has plunged to $178 levels and is ready to breach the low formed by the bullish candle. The gap that was formed by the breakout is likely to get filled. The overheated average directional index (ADX) (14) is declining to a developed uptrend region at 35 levels. The RSI (14) has drifted to 51 levels, signifying diminishing bullish strength. Therefore, to sustain the bullishness of the rally, the indicator has to establish support at the center line (51). The descending price rally would rest after filling the gap if both indicators maintain their bullish level. IBM has the strong support at $175 and below that, $171. |

|
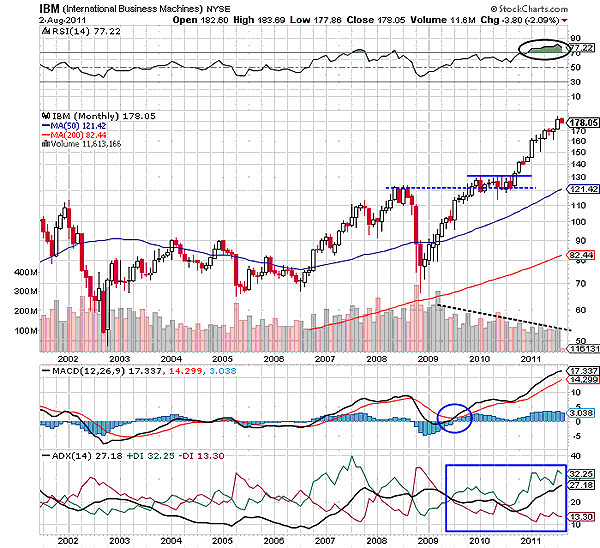
| FIGURE 2: IBM, MONTHLY |
| Graphic provided by: StockCharts.com. |
| |
| The monthly chart of IBM shows support-resistance at $121. The rally that began at $65 established support at $121 levels and consolidated for more than six months. A bullish flag & pennant formed due to the sideways price action. Price underwent a robust breakout in October 2010. I mentioned the target of $189 in my article dated September 9, 2010 ("IBM At All-Time High"). This long-term breakout rally has reached $178, and the indicators in Figure 2 suggest a steady rally toward the target. |
| The overbought RSI (14) at 77 levels is indicating bullish strength, and the moving average convergence/divergence (MACD) (12,26,9) turned positive after a bullish crossover at the zero line. In addition, the uptrend is developing in Figure 2. Thus, the bullish journey of IBM would definitely reach the target of $189 levels (130 - 75 = 55 + 134 = 189) in the long term. Due to shrinking volume, future movement is likely to be a little slow. Traders with long positions can hold on to their positions and those waiting on sidelines can trigger their trade at current levels. |
| Thus, IBM would remain healthy in the near future as well. The ongoing corrective rally is a good buying opportunity for fresh traders and investors. |
Active trader in the Indian stock markets since 2003 and a full-time writer. Trading is largely based upon technical analysis.
| Company: | Independent |
| Address: | C1/3 Parth Indraprasth Towers. Vastrapur |
| Ahmedabad, Guj 380015 | |
| E-mail address: | chaitalimohile@yahoo.co.in |
Traders' Resource Links | |
| Independent has not added any product or service information to TRADERS' RESOURCE. | |
Click here for more information about our publications!
PRINT THIS ARTICLE

Request Information From Our Sponsors
- StockCharts.com, Inc.
- Candle Patterns
- Candlestick Charting Explained
- Intermarket Technical Analysis
- John Murphy on Chart Analysis
- John Murphy's Chart Pattern Recognition
- John Murphy's Market Message
- MurphyExplainsMarketAnalysis-Intermarket Analysis
- MurphyExplainsMarketAnalysis-Visual Analysis
- StockCharts.com
- Technical Analysis of the Financial Markets
- The Visual Investor
- VectorVest, Inc.
- Executive Premier Workshop
- One-Day Options Course
- OptionsPro
- Retirement Income Workshop
- Sure-Fire Trading Systems (VectorVest, Inc.)
- Trading as a Business Workshop
- VectorVest 7 EOD
- VectorVest 7 RealTime/IntraDay
- VectorVest AutoTester
- VectorVest Educational Services
- VectorVest OnLine
- VectorVest Options Analyzer
- VectorVest ProGraphics v6.0
- VectorVest ProTrader 7
- VectorVest RealTime Derby Tool
- VectorVest Simulator
- VectorVest Variator
- VectorVest Watchdog
