HOT TOPICS LIST
- MACD
- Fibonacci
- RSI
- Gann
- ADXR
- Stochastics
- Volume
- Triangles
- Futures
- Cycles
- Volatility
- ZIGZAG
- MESA
- Retracement
- Aroon
INDICATORS LIST
LIST OF TOPICS
PRINT THIS ARTICLE
by Chaitali Mohile
The bears are ready to engulf the bullish rally of Pfizer.
Position: Sell
Chaitali Mohile
Active trader in the Indian stock markets since 2003 and a full-time writer. Trading is largely based upon technical analysis.
PRINT THIS ARTICLE
ROUND TOP & BOTTOM
Pfizer Forming A Rounded-Top Formation
08/02/11 10:37:39 AMby Chaitali Mohile
The bears are ready to engulf the bullish rally of Pfizer.
Position: Sell
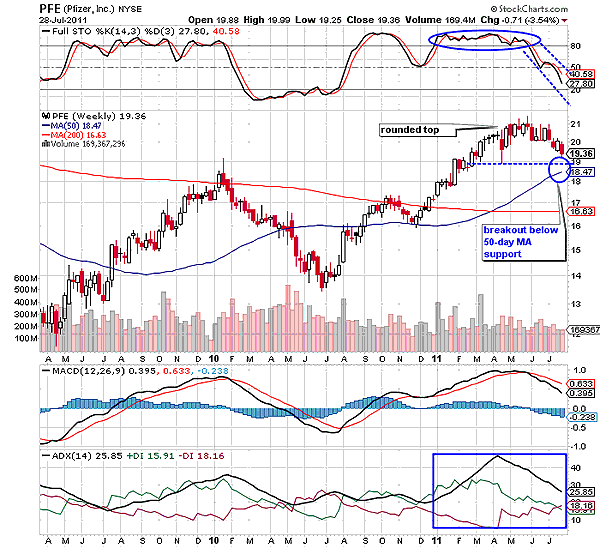
| A rounded-top is a bearish indication that terminates the existing upward rally. The formations signify the possible reversal of a current uptrend to a downtrend. It also indicates that the stock or index has topped and is likely to begin a fresh bearish rally in the next few trading sessions. In Figure 1, Pfizer (PFE) has formed the rounded top on its weekly time frame chart. An overheated uptrend spoiled the bullish party of PFE. The upward price action turned down at 21 levels, showing a weakness in the rally. The full stochastic (14,3,3) was overbought for five months, suggesting the possibility of a trend reversal. The rounded top in Figure 1 has the support at 19 levels; however, a bearish breakout will be confirmed below the 50-day moving average (MA) support. |

|
| FIGURE 1: PFE, WEEKLY. The rounded top would break out below the 50-day MA support. |
| Graphic provided by: StockCharts.com. |
| |
| The average directional index (ADX) (14) is descending from the overheated to the developing area. The buying pressure indicated by the positive directional index (+DI) has declined drastically; therefore, the uptrend is likely to weaken further. The moving average convergence/divergence (MACD) (12,26,9) has undergone a bearish crossover in positive territory. These bearish indications would break the rounded top downward. After the breakout, PFE would enter a fresh downtrend. Currently, there is enough space for the stochastic oscillator to plunge in an oversold region. Therefore, the price rally also has a long way to travel in the bearish direction. |

|
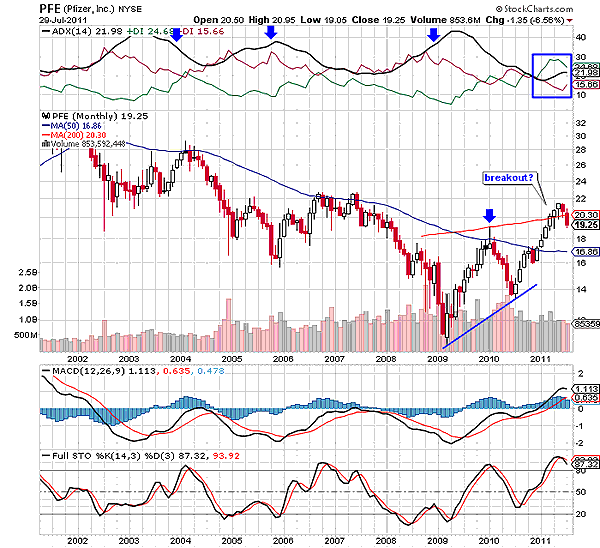
| FIGURE 2: PFE, MONTHLY. The stock is unable to sustain above the 200-day MA support. |
| Graphic provided by: StockCharts.com. |
| |
| The 200-day moving average (MA) resistance has restricted the bullish rally of PFE on the monthly chart in Figure 2. Although the price marginally violated the MA resistance, the hanging man candlestick pattern revealed the bearish signal for the stock. Immediately, the price began to descend. The robust downtrend that ruled the stock for more than five years had reversed. However, the uptrend could not develop strongly. Earlier in 2010, both the MA resistances were challenged by the price rally. In Figure 2, the 50-day moving average (MA) has been the strongest resistance for the stock, which was never violated. Hence, converting these resistances to support in 2011 was tough for PFE. |
| An overbought stochastic is ready to plunge. The MACD (12,26,9) is unstable while surging in positive territory. The ADX (14) slowly developed the uptrend, but the +DI is not encouraging. Therefore, PFE is ready to reenter the downtrend. |
| To conclude, the rounded top's bearish breakout would enhance the selling pressure, and gradually, the bears would engulf the price rally of PFE. |
Active trader in the Indian stock markets since 2003 and a full-time writer. Trading is largely based upon technical analysis.
| Company: | Independent |
| Address: | C1/3 Parth Indraprasth Towers. Vastrapur |
| Ahmedabad, Guj 380015 | |
| E-mail address: | chaitalimohile@yahoo.co.in |
Traders' Resource Links | |
| Independent has not added any product or service information to TRADERS' RESOURCE. | |
Click here for more information about our publications!
Comments
Date: 08/03/11Rank: Comment: The full stochastic (14,3,3) was overbought for five months, suggesting the possibility of a trend reversal. The rounded top in Figure 1 has the support at 19 levels; however, a bearish breakout will be confirmed below the 50-day moving average (MA) support.
* DEAR MR. MOHILE, I THINK YOU WOULD SAY ..... BELOW THE 50-WEEK OR 50-PERIOD MOVING AVERAGE, INSTEAD OF 50-DAY, SINCE IT IS WEEKLY CHART .. ?...
BEST REGARDS,
KUNTJORO

Request Information From Our Sponsors
- StockCharts.com, Inc.
- Candle Patterns
- Candlestick Charting Explained
- Intermarket Technical Analysis
- John Murphy on Chart Analysis
- John Murphy's Chart Pattern Recognition
- John Murphy's Market Message
- MurphyExplainsMarketAnalysis-Intermarket Analysis
- MurphyExplainsMarketAnalysis-Visual Analysis
- StockCharts.com
- Technical Analysis of the Financial Markets
- The Visual Investor
- VectorVest, Inc.
- Executive Premier Workshop
- One-Day Options Course
- OptionsPro
- Retirement Income Workshop
- Sure-Fire Trading Systems (VectorVest, Inc.)
- Trading as a Business Workshop
- VectorVest 7 EOD
- VectorVest 7 RealTime/IntraDay
- VectorVest AutoTester
- VectorVest Educational Services
- VectorVest OnLine
- VectorVest Options Analyzer
- VectorVest ProGraphics v6.0
- VectorVest ProTrader 7
- VectorVest RealTime Derby Tool
- VectorVest Simulator
- VectorVest Variator
- VectorVest Watchdog
