HOT TOPICS LIST
- MACD
- Fibonacci
- RSI
- Gann
- ADXR
- Stochastics
- Volume
- Triangles
- Futures
- Cycles
- Volatility
- ZIGZAG
- MESA
- Retracement
- Aroon
INDICATORS LIST
LIST OF TOPICS
PRINT THIS ARTICLE
by Koos van der Merwe
Symmetrical triangles can be a shakeout or an end run.
Position: Buy
Koos van der Merwe
Has been a technical analyst since 1969, and has worked as a futures and options trader with First Financial Futures in Johannesburg, South Africa.
PRINT THIS ARTICLE
TRIANGLES
A Triangle In The Making
07/29/11 09:09:59 AMby Koos van der Merwe
Symmetrical triangles can be a shakeout or an end run.
Position: Buy
| Symmetrical triangles, also known as a "coil," is very common and is formed by an uncertain market. Each price fluctuates smaller than its predecessor, resulting in a pattern bounded by a downtrend and an uptrend as shown in Figure 1. By definition, a symmetrical triangle must have at least four reversal points, when a breakout may occur at any time in the triangle before the apex is reached. They are not as reliable as head & shoulder formations, and in reality are subject to false breakouts called "shakeouts" or "end runs." |

|
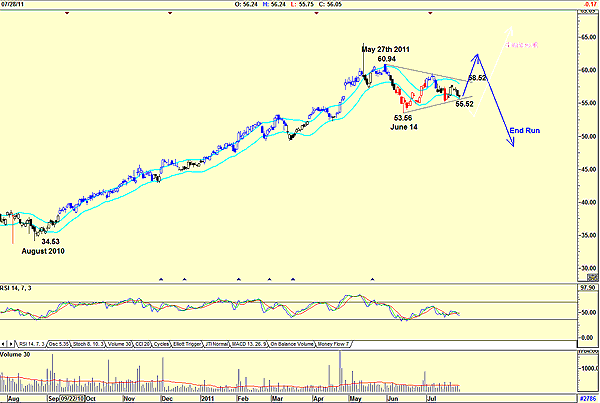
| FIGURE 1: VIACOM, DAILY. Here's the Viacom daily chart showing a possible outcome of the pattern. |
| Graphic provided by: AdvancedGET. |
| |
| Figure 1 shows how the price rose strongly from a low of $34.53 in August 2010 to a high of $60.94 by May 27, 2011. The price then fell to $53.56 by June 14, along with the relative strength index (RSI), which then gave a buy signal. Since that date, the price has vacillated along with the market. We can now expect two formations to occur: 1. Shakeout. Should the price fall below the upslanting line, in the region of $55.52, the price will fall lower before rising to a new high, with a target in the region of $91 (60.94 - 34.53 = 26.41 + 55.52 = 91.93). I have shown the expected move in red. 2. End run. Should the price break out upward in the region of $58.52, the price will rise to test the $60.94 peak and then fall lower. The only way to identify which formation is in the offing is to look at the volume. A breakout to the upside with the shakeout pattern will be on high volume, whereas a light volume will indicate a false move and the end run pattern. As the chart shows, volume appears to be light, suggesting the end run pattern. |
Has been a technical analyst since 1969, and has worked as a futures and options trader with First Financial Futures in Johannesburg, South Africa.
| Address: | 3256 West 24th Ave |
| Vancouver, BC | |
| Phone # for sales: | 6042634214 |
| E-mail address: | petroosp@gmail.com |
Click here for more information about our publications!
Comments

Request Information From Our Sponsors
- StockCharts.com, Inc.
- Candle Patterns
- Candlestick Charting Explained
- Intermarket Technical Analysis
- John Murphy on Chart Analysis
- John Murphy's Chart Pattern Recognition
- John Murphy's Market Message
- MurphyExplainsMarketAnalysis-Intermarket Analysis
- MurphyExplainsMarketAnalysis-Visual Analysis
- StockCharts.com
- Technical Analysis of the Financial Markets
- The Visual Investor
- VectorVest, Inc.
- Executive Premier Workshop
- One-Day Options Course
- OptionsPro
- Retirement Income Workshop
- Sure-Fire Trading Systems (VectorVest, Inc.)
- Trading as a Business Workshop
- VectorVest 7 EOD
- VectorVest 7 RealTime/IntraDay
- VectorVest AutoTester
- VectorVest Educational Services
- VectorVest OnLine
- VectorVest Options Analyzer
- VectorVest ProGraphics v6.0
- VectorVest ProTrader 7
- VectorVest RealTime Derby Tool
- VectorVest Simulator
- VectorVest Variator
- VectorVest Watchdog
