HOT TOPICS LIST
- MACD
- Fibonacci
- RSI
- Gann
- ADXR
- Stochastics
- Volume
- Triangles
- Futures
- Cycles
- Volatility
- ZIGZAG
- MESA
- Retracement
- Aroon
INDICATORS LIST
LIST OF TOPICS
PRINT THIS ARTICLE
by Billy Williams
There were critical lessons to be learned from July 2011 for a trader that could affect your trading either positively or negatively, depending if you truly know what they are.
Position: Hold
Billy Williams
Billy Williams has been trading the markets for 27 years, specializing in momentum trading with stocks and options.
PRINT THIS ARTICLE
STRATEGIES
Critical Lessons From July 2011
07/28/11 09:01:09 AMby Billy Williams
There were critical lessons to be learned from July 2011 for a trader that could affect your trading either positively or negatively, depending if you truly know what they are.
Position: Hold
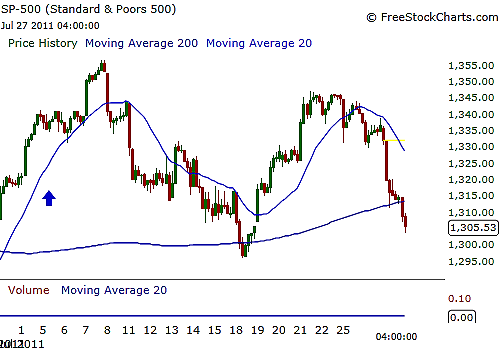
| The dog days of summer proved especially brutal for the Standard & Poor's 500 in July 2011. The SPX started the month with promise but rolled over and is foundering as you read this (Figure 1). It appears that things have played out just as I thought they might, giving you the opportunity to reflect on the lessons offered by this challenging seasonal pattern. |

|
| FIGURE 1: S&P 500. The SPX started out with a bang but quickly fizzled out. This could have fooled traders into thinking a summer rally was about to develop, but if you knew July's history of price behavior, you could have avoided the false signal. |
| Graphic provided by: www.freestockcharts.com. |
| |
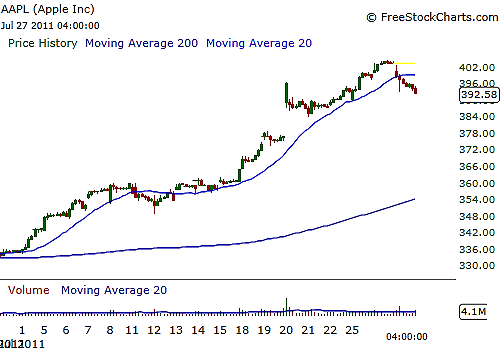
| To recap, according to the Stock Trader's Almanac 2011, the month of July tends to be the best-performing month of the summer season, but this can be a false signal that can sucker in unsuspecting traders. The reason for this is twofold; one, the historical price action beginning in May has been one of an nonperforming market that offers little in the way of opportunity until the autumn season begins, and two, while July has generally been the best-performing month of the pattern and can lead inexperienced traders into thinking that this is the beginning of a summer rally (Figure 2), the truth is that this is false because, overall, it is not enough to overcome the nonperforming aspect of the summer pattern. |

|
| FIGURE 2: AAPL. AAPL has retained its status as a market leader, and during July, the stock could have capitalized on its price action and banked a solid profit. |
| Graphic provided by: www.freestockcharts.com. |
| |
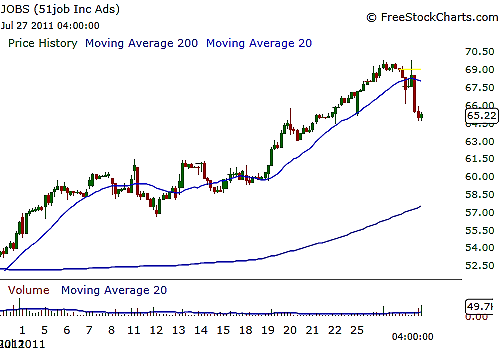
| From one of my earlier articles: "While the market has been lackluster, you can begin by finding stocks that have held up and are trading close to their price highs. Scan the market for stocks with high relative strength compared to other segments of the market but still have respectable 20-day volume averages of over 250,000 shares traded daily. Typically, you can look for stocks that trade at a 100,000 daily average but during July, volume tends to thin out and you want to maintain the ability to move in and out of the market so as to not get stuck in a sudden price move against you while overall interest and involvement remains low. "Finally, pay particular close attention to stocks that are trading at their all-time price highs. " See Figure 3. |

|
| FIGURE 3: JOBS, 60-MINUTE. JOBS was another strong-performing stock that held up well during July, as you can see from its steady trend upward on the 60-minute chart. |
| Graphic provided by: www.freestockcharts.com. |
| |
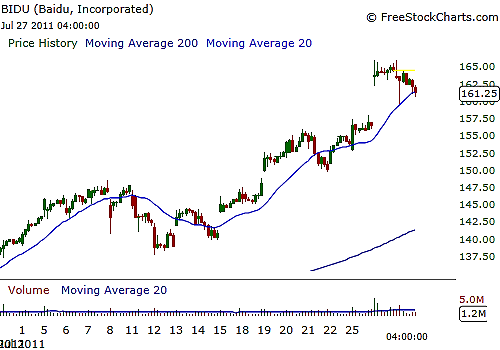
| Stocks that mirrored these recommendations ended up performing well to relatively outstanding. The combination of price and relative strength took advantage of July's short-term momentum to the upside and even when the SPX rolled over and declined. The stocks themselves were able to keep making higher highs and higher lows due to their exceptional strength and high trading volume, which acted as fuel for their price move. Beginning on July 1, 2011, stocks such as Apple Inc., Google, Baidu.com (Figure 4), and 51 Jobs Inc. had strong months, giving short-term traders and option traders the opportunity to trade them as they trended upward. |

|
| FIGURE 4: BIDU, 60-MINUTE. BIDU's hourly chart shows that it rose upward in tandem with the SPX and even pulled back but refused to follow the SPX's decline and broke higher for a strong breakout entry. |
| Graphic provided by: www.freestockcharts.com. |
| |
| The bottom line for you is that if you want to take advantage of these brief windows of opportunities, then it will be critical for you to spend time developing a strategy on relevant market statistics that give you a window into both the past and future bias of price action and then develop a strategy. Knowing seasonal patterns as well as other aspects of price behavior can give you a slight edge, but that is typically the only edge you need in order to tailor your approach on the context of the market. |
Billy Williams has been trading the markets for 27 years, specializing in momentum trading with stocks and options.
| Company: | StockOptionSystem.com |
| E-mail address: | stockoptionsystem.com@gmail.com |
Traders' Resource Links | |
| StockOptionSystem.com has not added any product or service information to TRADERS' RESOURCE. | |
Click here for more information about our publications!
PRINT THIS ARTICLE

Request Information From Our Sponsors
- StockCharts.com, Inc.
- Candle Patterns
- Candlestick Charting Explained
- Intermarket Technical Analysis
- John Murphy on Chart Analysis
- John Murphy's Chart Pattern Recognition
- John Murphy's Market Message
- MurphyExplainsMarketAnalysis-Intermarket Analysis
- MurphyExplainsMarketAnalysis-Visual Analysis
- StockCharts.com
- Technical Analysis of the Financial Markets
- The Visual Investor
- VectorVest, Inc.
- Executive Premier Workshop
- One-Day Options Course
- OptionsPro
- Retirement Income Workshop
- Sure-Fire Trading Systems (VectorVest, Inc.)
- Trading as a Business Workshop
- VectorVest 7 EOD
- VectorVest 7 RealTime/IntraDay
- VectorVest AutoTester
- VectorVest Educational Services
- VectorVest OnLine
- VectorVest Options Analyzer
- VectorVest ProGraphics v6.0
- VectorVest ProTrader 7
- VectorVest RealTime Derby Tool
- VectorVest Simulator
- VectorVest Variator
- VectorVest Watchdog
