HOT TOPICS LIST
- MACD
- Fibonacci
- RSI
- Gann
- ADXR
- Stochastics
- Volume
- Triangles
- Futures
- Cycles
- Volatility
- ZIGZAG
- MESA
- Retracement
- Aroon
INDICATORS LIST
LIST OF TOPICS
PRINT THIS ARTICLE
by Mike Carr, CMT
Will stocks and the euro act the same as when the Fed undertook QE?
Position: Hold
Mike Carr, CMT
Mike Carr, CMT, is a member of the Market Technicians Association, and editor of the MTA's newsletter, Technically Speaking. He is also the author of "Smarter Investing in Any Economy: The Definitive Guide to Relative Strength Investing," and "Conquering the Divide: How to Use Economic Indicators to Catch Stock Market Trends."
PRINT THIS ARTICLE
CHART ANALYSIS
Greek Bailout Smells Like QE
07/28/11 08:45:38 AMby Mike Carr, CMT
Will stocks and the euro act the same as when the Fed undertook QE?
Position: Hold
| Recently, the European central bank (ECB) announced a plan to avoid default on Greek bonds, at least for the short term. Pundits are debating what the long-term impact will be and ratings agencies are debating whether the plan actually avoids a default. Technical analysts can bypass the debates and look at what it means to them as traders. |
| In effect, the ECB is buying Greek debt has gone bad and replenishing bank balance sheets with euros. This action is eerily similar to the Federal Reserve's quantitative easing programs where they bought bonds from banks and allowed the banks to rebuild their cash reserves. In response to the most recent round of quantitative easing, which ran from August 2010 through June 2011 and was known as QE2, stocks soared as the dollar fell. This is a logical result since the Fed added dollars to the economy, and some of those dollars inevitably wound up in the stock market. |
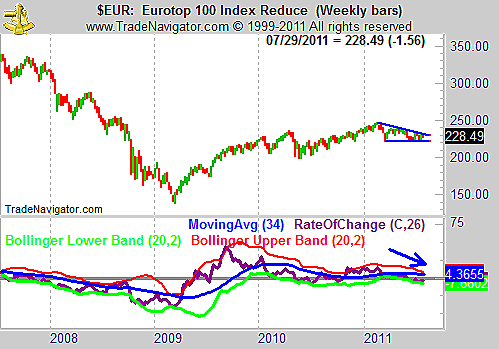
| European stocks looked weak prior to the announcement. The weekly chart (Figure 1) shows a bearish triangle formation and deteriorating momentum. The Eurotop 100 Index is shown as a representative sample of a large-cap index of European stocks. The rate of change (ROC) indicator is used to show momentum. |

|
| FIGURE 1: $EUR, WEEKLY. Momentum is pointing down after the Eurotop 100 failed to rally back to its old highs. |
| Graphic provided by: Trade Navigator. |
| |
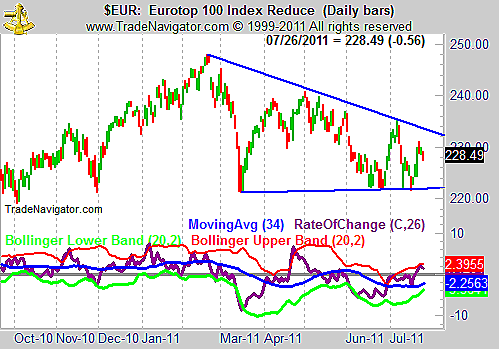
| The daily chart (Figure 2) shows a short-term bounce, most likely driven by the news of the agreement. Momentum and prices moved higher, but the price rise may already be ending. |

|
| FIGURE 2: $EUR, DAILY. The daily price chart shows the impact that news can have on a market. |
| Graphic provided by: Trade Navigator. |
| |
| Only time will tell, but European stocks may well be set to follow the same course that US stocks enjoyed during quantitative easing. In August 2010, when QE2 was announced, the Standard & Poor's 500 was also in a bearish pattern with negative momentum on a weekly chart. Traders should be alert to the possibility of an upside breakout in European stocks and trade it as if it will have follow-through. Downside breaks would indicate very bearish conditions since stocks would be failing to rally, even though investment cash should be available. |
Mike Carr, CMT, is a member of the Market Technicians Association, and editor of the MTA's newsletter, Technically Speaking. He is also the author of "Smarter Investing in Any Economy: The Definitive Guide to Relative Strength Investing," and "Conquering the Divide: How to Use Economic Indicators to Catch Stock Market Trends."
| Website: | www.moneynews.com/blogs/MichaelCarr/id-73 |
| E-mail address: | marketstrategist@gmail.com |
Click here for more information about our publications!
PRINT THIS ARTICLE

Request Information From Our Sponsors
- VectorVest, Inc.
- Executive Premier Workshop
- One-Day Options Course
- OptionsPro
- Retirement Income Workshop
- Sure-Fire Trading Systems (VectorVest, Inc.)
- Trading as a Business Workshop
- VectorVest 7 EOD
- VectorVest 7 RealTime/IntraDay
- VectorVest AutoTester
- VectorVest Educational Services
- VectorVest OnLine
- VectorVest Options Analyzer
- VectorVest ProGraphics v6.0
- VectorVest ProTrader 7
- VectorVest RealTime Derby Tool
- VectorVest Simulator
- VectorVest Variator
- VectorVest Watchdog
- StockCharts.com, Inc.
- Candle Patterns
- Candlestick Charting Explained
- Intermarket Technical Analysis
- John Murphy on Chart Analysis
- John Murphy's Chart Pattern Recognition
- John Murphy's Market Message
- MurphyExplainsMarketAnalysis-Intermarket Analysis
- MurphyExplainsMarketAnalysis-Visual Analysis
- StockCharts.com
- Technical Analysis of the Financial Markets
- The Visual Investor
