

HOT TOPICS LIST
- MACD
- Fibonacci
- RSI
- Gann
- ADXR
- Stochastics
- Volume
- Triangles
- Futures
- Cycles
- Volatility
- ZIGZAG
- MESA
- Retracement
- Aroon
INDICATORS LIST
LIST OF TOPICS
PRINT THIS ARTICLE
by Billy Williams
Measuring pullbacks with Fibonacci retracements can mean different things as far as the strength of the trend is concerned, plus one added secret if you know what to look for.
Position: Buy
Billy Williams
Billy Williams has been trading the markets for 27 years, specializing in momentum trading with stocks and options.
PRINT THIS ARTICLE
Fibonacci Retracements And Runaway Markets
07/27/11 09:41:57 AMby Billy Williams
Measuring pullbacks with Fibonacci retracements can mean different things as far as the strength of the trend is concerned, plus one added secret if you know what to look for.
Position: Buy
| Markets that are trending make a steady series of higher highs and higher lows in a bullish market and lower highs and lower lows in a bearish market that give traders sitting on the sidelines an opportunity to buy or sell on the pullbacks. However, beginning traders and even some experienced traders are unsure as to when to enter a position as well as what to expect once a position is taken. These are normal fears that can be eliminated through a brief study of Fibonacci numbers, the corresponding retracement levels, and what can be expected when taking a position at a given retracement level. Fibonacci numbers and retracements are the work of Leonardo of Pisa, a 13th-century Italian mathematician, and are based on mathematical patterns occurring in nature that can also be applied to the market. The most common Fibonacci retracement levels are 0.382, 0.50, and 0.618 Fibonacci. |
|
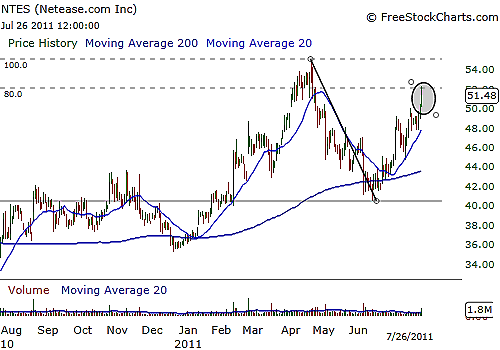
| FIGURE 1: NTES. NTES recently underwent a steep pullback but has since retraced back 80% of its decline, indicating that it is likely going to challenge its previous price high and resume its uptrend. |
| Graphic provided by: www.freestockcharts.com. |
| |
| These retracements are a way of measuring the depth of a price pullback in a stock's price action and can also indicate the strength of the trend as it resumes its direction, giving you a framework on which to base your trading decisions. (See Figure 1.) The 0.382 Fibonacci retracement level is commonly referred to a "shallow" retracement, and a price pullback to this level has the highest probability of resuming its trend and trading to new highs or lows, depending on the context of the market and stock that you are trading. |
| The 0.50 Fibonacci retracement has the second-highest probability of continuing on its current primary direction from this level because like the 0.382 shallow retracement, this is considered a healthy pullback in price action for traders to exit with a profit. Traders who had been on the sidelines watching the action take place can now jump in to add to existing positions and it is also a good place for new traders to enter into new positions to exploit the security's momentum for profit. As for the 0.618 Fibonacci retracement, the odds of meeting or exceeding the price high before the pullback is lessened. While it is possible that price might meet or exceed that high, it is more likely that price will consolidate after getting close to it or finding resistance. This is because the depth of the pullback indicates a strong-enough force in the opposite direction that reflects the psychology of the traders involved, indicating a lack of conviction that the underlying security's trend will continue or resume. |
| However, there is a way to measure the "retracement of the retracement" by observing how price climbs back from a 0.618 or greater Fibonacci retracement. If price trades back up 80% of the range of a retracement, there is a strong chance of at least 80% or more that price will go on to challenge its former high and then exceed it. This type of price action indicates a strong trade setup in the works where you can then enter as the trend resumes or even enter early in the expectation that price will challenge its previous price high before the initial pullback and take advantage of benefiting by spotting the move early on for added profit potential. |
Billy Williams has been trading the markets for 27 years, specializing in momentum trading with stocks and options.
| Company: | StockOptionSystem.com |
| E-mail address: | stockoptionsystem.com@gmail.com |
Traders' Resource Links | |
| StockOptionSystem.com has not added any product or service information to TRADERS' RESOURCE. | |
Click here for more information about our publications!
Comments
Date:�06/15/17Rank:�5Comment:�

Request Information From Our Sponsors
- StockCharts.com, Inc.
- Candle Patterns
- Candlestick Charting Explained
- Intermarket Technical Analysis
- John Murphy on Chart Analysis
- John Murphy's Chart Pattern Recognition
- John Murphy's Market Message
- MurphyExplainsMarketAnalysis-Intermarket Analysis
- MurphyExplainsMarketAnalysis-Visual Analysis
- StockCharts.com
- Technical Analysis of the Financial Markets
- The Visual Investor
- VectorVest, Inc.
- Executive Premier Workshop
- One-Day Options Course
- OptionsPro
- Retirement Income Workshop
- Sure-Fire Trading Systems (VectorVest, Inc.)
- Trading as a Business Workshop
- VectorVest 7 EOD
- VectorVest 7 RealTime/IntraDay
- VectorVest AutoTester
- VectorVest Educational Services
- VectorVest OnLine
- VectorVest Options Analyzer
- VectorVest ProGraphics v6.0
- VectorVest ProTrader 7
- VectorVest RealTime Derby Tool
- VectorVest Simulator
- VectorVest Variator
- VectorVest Watchdog