HOT TOPICS LIST
- MACD
- Fibonacci
- RSI
- Gann
- ADXR
- Stochastics
- Volume
- Triangles
- Futures
- Cycles
- Volatility
- ZIGZAG
- MESA
- Retracement
- Aroon
INDICATORS LIST
LIST OF TOPICS
PRINT THIS ARTICLE
by Chaitali Mohile
The Gold & Silver Index - Philadelphia has been consolidating for six months. Will the index break out in the near future?
Position: N/A
Chaitali Mohile
Active trader in the Indian stock markets since 2003 and a full-time writer. Trading is largely based upon technical analysis.
PRINT THIS ARTICLE
CONSOLID FORMATION
$XAU Trapped In Wide Range
07/27/11 12:10:05 PMby Chaitali Mohile
The Gold & Silver Index - Philadelphia has been consolidating for six months. Will the index break out in the near future?
Position: N/A
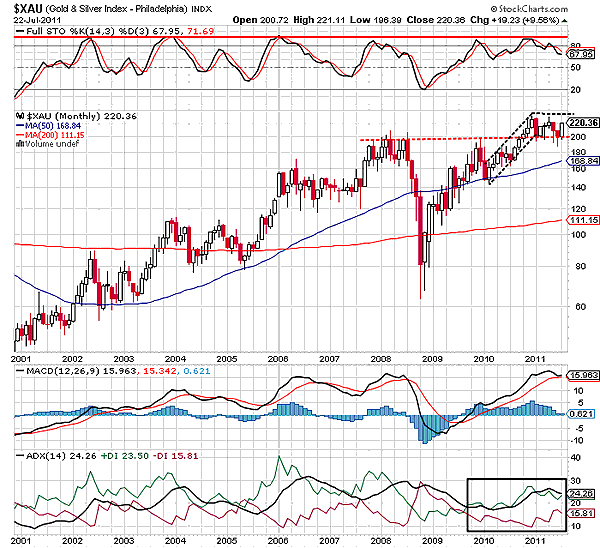
| A pullback rally of the Gold & Silver Index - Philadelphia ($XAU) rested twice during its journey. The index established its first support at the 50-day moving average (MA) in Figure 1. Thereafter, $XAU resumed the advance rally, breaching the previous high resistance at 198-200 levels. Earlier, the index had plunged from 198 levels, forming an intermediate resistance for the rally. After converting resistance to support, the rally moved sideways in the range of 240-200. We can see in Figure 1 that the index has been consolidating since early 2011. The index has formed a bullish flag & pennant formation on its monthly time frame in Figure 1. |

|
| FIGURE 1: $XAU, MONTHLY |
| Graphic provided by: StockCharts.com. |
| |
| An overbought full stochastic (14,3,3) has reached its resistance area above 80 levels. The shaky oscillator is showing volatility in the index. The momentum indicator was unable to surge above the 80 levels. Though the stochastic oscillator has been retracing from an overbought region, it did not lose its bullishness as the center line was respected. Currently, the stochastic is ready to retrace to the center line at 50 levels. Although the moving average convergence/divergence (MACD) (12,26,9) is extremely positive, a reversal possibility is not indicated in Figure 1. The average directional index (ADX) (14) is signifying a developing uptrend. Therefore, the indicators would support the bullish consolidation, which would lead to a bullish breakout in the future. |
| It would be risky to anticipate a breakout in the current situation. Hence, I am reluctant to calculate the minimum estimated levels. However, after the confirmed bullish breakout, the target can be measured by adding the length of the flag to the breakout point. |

|
| FIGURE 2: $XAU, WEEKLY |
| Graphic provided by: StockCharts.com. |
| |
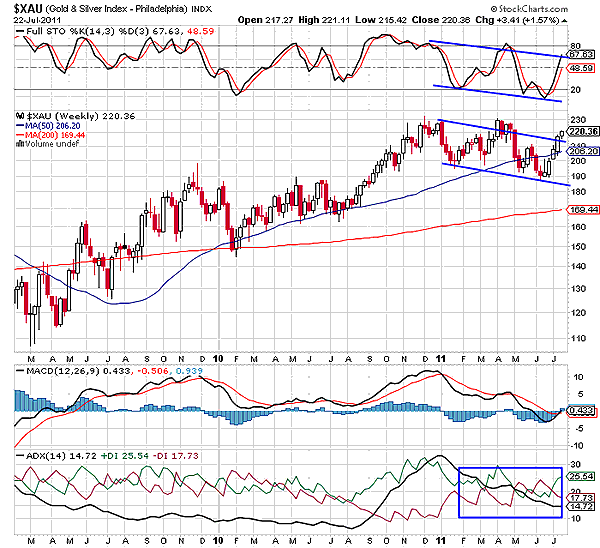
| The consolidation range was drifting downward, according to the weekly time frame in Figure 2. The lower lows and lower highs marked on the chart shows a descending channel. The full stochastic (14,3,3) and MACD (12,26,9) both are going lower as well. The ADX (14) is reflecting equal buying and selling pressure, which highlights consolidation. Thus, the sideways price action of $XAU would continue for some time. Currently, the index is ready to breach the upper trading range, but we need to wait for the confirmed bullish breakout. |
| The consolidation range would break upward after few weeks. The trend indicator on the weekly chart is weak, which would not allow the rally to breach the range. Therefore, $XAU would consolidate till a fresh uptrend develops. The trading range being a wide one, traders can trade during the consolidation period. |
Active trader in the Indian stock markets since 2003 and a full-time writer. Trading is largely based upon technical analysis.
| Company: | Independent |
| Address: | C1/3 Parth Indraprasth Towers. Vastrapur |
| Ahmedabad, Guj 380015 | |
| E-mail address: | chaitalimohile@yahoo.co.in |
Traders' Resource Links | |
| Independent has not added any product or service information to TRADERS' RESOURCE. | |
Click here for more information about our publications!
PRINT THIS ARTICLE

Request Information From Our Sponsors
- StockCharts.com, Inc.
- Candle Patterns
- Candlestick Charting Explained
- Intermarket Technical Analysis
- John Murphy on Chart Analysis
- John Murphy's Chart Pattern Recognition
- John Murphy's Market Message
- MurphyExplainsMarketAnalysis-Intermarket Analysis
- MurphyExplainsMarketAnalysis-Visual Analysis
- StockCharts.com
- Technical Analysis of the Financial Markets
- The Visual Investor
- VectorVest, Inc.
- Executive Premier Workshop
- One-Day Options Course
- OptionsPro
- Retirement Income Workshop
- Sure-Fire Trading Systems (VectorVest, Inc.)
- Trading as a Business Workshop
- VectorVest 7 EOD
- VectorVest 7 RealTime/IntraDay
- VectorVest AutoTester
- VectorVest Educational Services
- VectorVest OnLine
- VectorVest Options Analyzer
- VectorVest ProGraphics v6.0
- VectorVest ProTrader 7
- VectorVest RealTime Derby Tool
- VectorVest Simulator
- VectorVest Variator
- VectorVest Watchdog
