HOT TOPICS LIST
- MACD
- Fibonacci
- RSI
- Gann
- ADXR
- Stochastics
- Volume
- Triangles
- Futures
- Cycles
- Volatility
- ZIGZAG
- MESA
- Retracement
- Aroon
INDICATORS LIST
LIST OF TOPICS
PRINT THIS ARTICLE
by Koos van der Merwe
We all know what a gap is. However, are you aware that there are three types of gaps?
Position: N/A
Koos van der Merwe
Has been a technical analyst since 1969, and has worked as a futures and options trader with First Financial Futures in Johannesburg, South Africa.
PRINT THIS ARTICLE
GAPS
Those Google Gaps
07/26/11 09:05:01 AMby Koos van der Merwe
We all know what a gap is. However, are you aware that there are three types of gaps?
Position: N/A
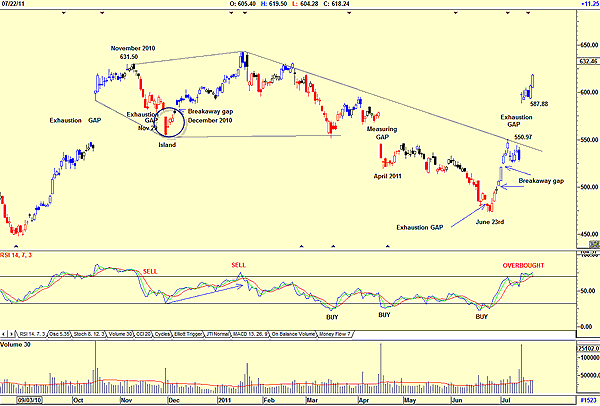
| Gaps happen when a price either jumps up with the new low being higher than the previous day's high, or falls down, where today's high is considerably lower than yesterday's low. There are three types of gap: a. Breakaway gap: Usually found at the lower end of a market move b. Exhaust gap: Found at the top of the market and calling for a reverse in trend c. Measuring gap: Always found midway in the market and suggesting a pause in the trend. My chart of Google, shown in Figure 1, illustrates the various gaps. Note the exhaustion gap in October 2010 that led to the high of $631.50 by November 2010. Note also that with the exhaustion gap, the relative strength index (RSI) was at overbought levels. |

|
| FIGURE 1: GOOG, DAILY. Here, Google is showing gaps. |
| Graphic provided by: AdvancedGET. |
| |
| On November 29, 2010, GOOG traced an exhaustion gap on rising volume, followed by a breakaway gap of December 2010 that occurred on a rising RSI. This created what is known as an island, which reinforces the uptrend after the breakaway gap. The measuring gap of April 2011 occurred with the RSI giving a "trivergence" buy signal, where the RSI gave three buy signals, two of which were failures. It was only after the much smaller exhaustion gap on June 23, 2011, that the RSI buy signal became effective. The share price then rose on two tiny breakaway gaps to test the long-term resistance line, eventually breaking it in an exhaustion gap with the RSI at oversold levels. Do note the sharp increase in volume with every major gap that occurred. Would I be a buyer of Google shares at the moment? No. I would wait for the stock price to fall to fill the recent exhaustion gap somewhere between $550.97 and $587.88 with the RSI below or at the 32 level. |
Has been a technical analyst since 1969, and has worked as a futures and options trader with First Financial Futures in Johannesburg, South Africa.
| Address: | 3256 West 24th Ave |
| Vancouver, BC | |
| Phone # for sales: | 6042634214 |
| E-mail address: | petroosp@gmail.com |
Click here for more information about our publications!
PRINT THIS ARTICLE

Request Information From Our Sponsors
- StockCharts.com, Inc.
- Candle Patterns
- Candlestick Charting Explained
- Intermarket Technical Analysis
- John Murphy on Chart Analysis
- John Murphy's Chart Pattern Recognition
- John Murphy's Market Message
- MurphyExplainsMarketAnalysis-Intermarket Analysis
- MurphyExplainsMarketAnalysis-Visual Analysis
- StockCharts.com
- Technical Analysis of the Financial Markets
- The Visual Investor
- VectorVest, Inc.
- Executive Premier Workshop
- One-Day Options Course
- OptionsPro
- Retirement Income Workshop
- Sure-Fire Trading Systems (VectorVest, Inc.)
- Trading as a Business Workshop
- VectorVest 7 EOD
- VectorVest 7 RealTime/IntraDay
- VectorVest AutoTester
- VectorVest Educational Services
- VectorVest OnLine
- VectorVest Options Analyzer
- VectorVest ProGraphics v6.0
- VectorVest ProTrader 7
- VectorVest RealTime Derby Tool
- VectorVest Simulator
- VectorVest Variator
- VectorVest Watchdog
