HOT TOPICS LIST
- MACD
- Fibonacci
- RSI
- Gann
- ADXR
- Stochastics
- Volume
- Triangles
- Futures
- Cycles
- Volatility
- ZIGZAG
- MESA
- Retracement
- Aroon
INDICATORS LIST
LIST OF TOPICS
PRINT THIS ARTICLE
by Mike Carr, CMT
Healthy bull markets in the past have been led higher by growth stocks in general and technology stocks in particular.
Position: Buy
Mike Carr, CMT
Mike Carr, CMT, is a member of the Market Technicians Association, and editor of the MTA's newsletter, Technically Speaking. He is also the author of "Smarter Investing in Any Economy: The Definitive Guide to Relative Strength Investing," and "Conquering the Divide: How to Use Economic Indicators to Catch Stock Market Trends."
PRINT THIS ARTICLE
RATE OF CHANGE
Tech Stocks Leading Market
07/25/11 01:06:48 PMby Mike Carr, CMT
Healthy bull markets in the past have been led higher by growth stocks in general and technology stocks in particular.
Position: Buy
| It's long been said that stocks need to climb a wall of worry. A debt crisis in Europe may spread from Greece to Spain, Portugal, and Ireland. That is combined with a debt ceiling crisis in the US and is providing plenty of worry for investors, and stocks are certainly climbing that wall. Major indexes have been in a trading range for the past several months, but an upside breakout appears more and more likely. The NASDAQ 100 is breaking out to new highs. This is an index consisting of 100 of the largest tech stocks. |
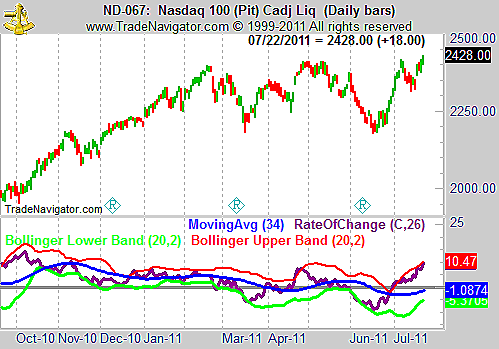
| The daily chart of the index is shown in Figure 1. Rate of change (ROC) is also shown, and this momentum indicator has been moving along the upper Bollinger Band since the end of June. That is generally a sign of strong momentum on the daily chart but could indicate an overbought market. A sharp break above the band usually is seen before an overbought market sells off. That is not visible in the chart. |

|
| FIGURE 1: NASDAQ, DAILY. Price has just broken to a new high in the index, possibly signaling an upward break from the range that has contained prices for several months. |
| Graphic provided by: Trade Navigator. |
| |
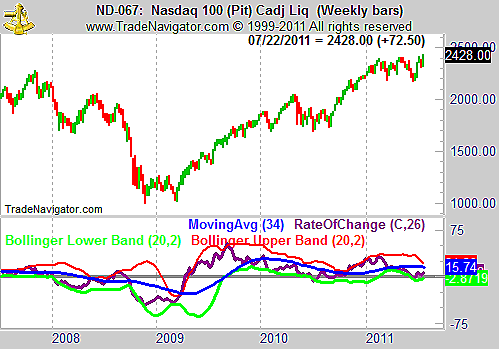
| The weekly chart (Figure 2) shows the index is far from overbought, using ROC as a momentum gauge. This would support higher prices for the tech stocks. |

|
| FIGURE 2: NASDAQ, WEEKLY. The ROC is close to the lower Bollinger Band in this weekly chart of the NASDAQ 100. |
| Graphic provided by: Trade Navigator. |
| |
| An overbought market, such as the one we saw at the end of 2010, can be relieved by a price decline or an extended trading range. Time has allowed the NASDAQ 100 to consolidate and the market should move higher from here, bringing other indexes along with it. |
Mike Carr, CMT, is a member of the Market Technicians Association, and editor of the MTA's newsletter, Technically Speaking. He is also the author of "Smarter Investing in Any Economy: The Definitive Guide to Relative Strength Investing," and "Conquering the Divide: How to Use Economic Indicators to Catch Stock Market Trends."
| Website: | www.moneynews.com/blogs/MichaelCarr/id-73 |
| E-mail address: | marketstrategist@gmail.com |
Click here for more information about our publications!
PRINT THIS ARTICLE

Request Information From Our Sponsors
- StockCharts.com, Inc.
- Candle Patterns
- Candlestick Charting Explained
- Intermarket Technical Analysis
- John Murphy on Chart Analysis
- John Murphy's Chart Pattern Recognition
- John Murphy's Market Message
- MurphyExplainsMarketAnalysis-Intermarket Analysis
- MurphyExplainsMarketAnalysis-Visual Analysis
- StockCharts.com
- Technical Analysis of the Financial Markets
- The Visual Investor
- VectorVest, Inc.
- Executive Premier Workshop
- One-Day Options Course
- OptionsPro
- Retirement Income Workshop
- Sure-Fire Trading Systems (VectorVest, Inc.)
- Trading as a Business Workshop
- VectorVest 7 EOD
- VectorVest 7 RealTime/IntraDay
- VectorVest AutoTester
- VectorVest Educational Services
- VectorVest OnLine
- VectorVest Options Analyzer
- VectorVest ProGraphics v6.0
- VectorVest ProTrader 7
- VectorVest RealTime Derby Tool
- VectorVest Simulator
- VectorVest Variator
- VectorVest Watchdog
