HOT TOPICS LIST
- MACD
- Fibonacci
- RSI
- Gann
- ADXR
- Stochastics
- Volume
- Triangles
- Futures
- Cycles
- Volatility
- ZIGZAG
- MESA
- Retracement
- Aroon
INDICATORS LIST
LIST OF TOPICS
PRINT THIS ARTICLE
by Chaitali Mohile
InterDigital is one of those stocks that frequently undergo wide gap breakouts for breaching the support-resistance levels.
Position: N/A
Chaitali Mohile
Active trader in the Indian stock markets since 2003 and a full-time writer. Trading is largely based upon technical analysis.
PRINT THIS ARTICLE
GAPS
It's An IDCC Breakout
07/22/11 12:20:31 PMby Chaitali Mohile
InterDigital is one of those stocks that frequently undergo wide gap breakouts for breaching the support-resistance levels.
Position: N/A
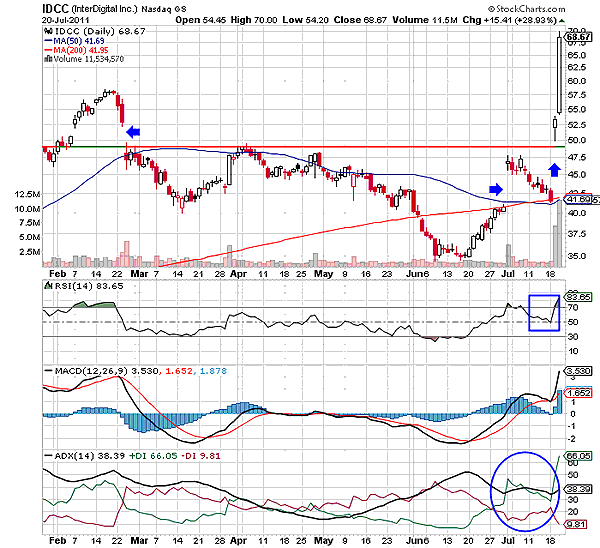
| InterDigital (IDCC) has been undergoing various gap breakouts in the past six months. In February 2011, IDCC broke the 50-day moving average (MA) support by a small gap down. Thereafter, the stock remained under the newly formed resistance. We can see in Figure 1 that IDCC challenged the resistance line but failed to reconvert it into support. Along with the MA resistance, the gap down also formed a robust bearish force at the 52.5 and 49 levels. The gaps formed either up or down always get filled, although the perfect time or period cannot be analyzed. Gradually, IDCC plunged below the 200-day MA support as well. The stock had to face the resistance from both moving averages. A consolidation at $35 stopped the bearish rally, preventing additional loss to the stock. This helped the price to begin a relief rally. |

|
| FIGURE 1: IDCC, DAILY |
| Graphic provided by: StockCharts.com. |
| |
| The two robust moving average resistances were breached by a huge gap up in Figure 1. Although the major resistance was violated, IDCC had another hurdle immediately at 49 levels. As a result, the breakout retraced toward the newly formed moving average supports. Once again, the stock witnessed a huge gap up breakout of about $9. We can see all three gaps were filled by IDCC. The support-resistance line was also breached by a gap up. Trading these gaps is very tricky, as they cannot be anticipated. The volume was not at all encouraging during the gap breakout. The current bullish breakout was the only event that saw a rise in the volume. The gap up was followed by a huge long bullish candle, showing a strong trading session on July 21. The day gave hefty profits for intraday traders only. |
| The relative strength index (RSI) (14) is healthily overbought, the average directional index (ADX) (14) is indicating a developing uptrend, and the positive moving average convergence/divergence (MACD) (12,26,9) is showing marginal volatility in positive territory. Considering these signals, we can anticipate that IDCC would remain bullish in the future as well. Since the stock has traveled 18 points in just two trading sessions, the price may consolidate in the next few days. Therefore, those traders who missed the opportunity in the previous bullish session (July 21) can trigger the long positions after the consolidation. These are just the guidelines for trading and understanding the gaps. |

|
| FIGURE 2: IDCC, MONTHLY |
| Graphic provided by: StockCharts.com. |
| |
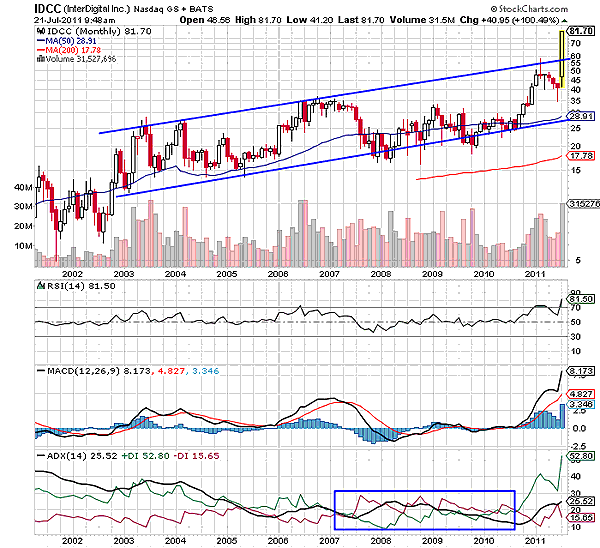
| On the monthly time frame in Figure 2, IDCC has formed an ascending channel. Both trendlines of the channel extended essential pressure on the price rally, preventing the breakout on either side. We can see that the rally consolidated exactly near the trendlines and also moved from one trendline to another, but failed to breach either of the trendlines. Thus, the stock has been traveling within the ascending channel for eight years. However, the huge gap up breakout helped the stock violate the upper trendline of the channel. This bullish breakout has occurred for the first time and therefore would be most reliable for the traders. IDCC should sustain above the upper trendline support for the stable breakout journey. |
| The uptrend is developing in Figure 2. The RSI (14) is surging in an overbought region and the MACD (12,26,9) is positive. The technical conditions on the chart are favorable for the stock to establish support at the upper trendline support. To conclude, the gap breakouts can break major support-resistance levels of a stock. But the gap cannot be followed in isolation; it has to be accompanied by indicators to ensure better trading. |
Active trader in the Indian stock markets since 2003 and a full-time writer. Trading is largely based upon technical analysis.
| Company: | Independent |
| Address: | C1/3 Parth Indraprasth Towers. Vastrapur |
| Ahmedabad, Guj 380015 | |
| E-mail address: | chaitalimohile@yahoo.co.in |
Traders' Resource Links | |
| Independent has not added any product or service information to TRADERS' RESOURCE. | |
Click here for more information about our publications!
PRINT THIS ARTICLE

Request Information From Our Sponsors
- StockCharts.com, Inc.
- Candle Patterns
- Candlestick Charting Explained
- Intermarket Technical Analysis
- John Murphy on Chart Analysis
- John Murphy's Chart Pattern Recognition
- John Murphy's Market Message
- MurphyExplainsMarketAnalysis-Intermarket Analysis
- MurphyExplainsMarketAnalysis-Visual Analysis
- StockCharts.com
- Technical Analysis of the Financial Markets
- The Visual Investor
- VectorVest, Inc.
- Executive Premier Workshop
- One-Day Options Course
- OptionsPro
- Retirement Income Workshop
- Sure-Fire Trading Systems (VectorVest, Inc.)
- Trading as a Business Workshop
- VectorVest 7 EOD
- VectorVest 7 RealTime/IntraDay
- VectorVest AutoTester
- VectorVest Educational Services
- VectorVest OnLine
- VectorVest Options Analyzer
- VectorVest ProGraphics v6.0
- VectorVest ProTrader 7
- VectorVest RealTime Derby Tool
- VectorVest Simulator
- VectorVest Variator
- VectorVest Watchdog
