HOT TOPICS LIST
- MACD
- Fibonacci
- RSI
- Gann
- ADXR
- Stochastics
- Volume
- Triangles
- Futures
- Cycles
- Volatility
- ZIGZAG
- MESA
- Retracement
- Aroon
INDICATORS LIST
LIST OF TOPICS
PRINT THIS ARTICLE
by Jamie Theiss
Why the bottoming tailbar is such a powerful reversal signal.
Position: Buy
Jamie Theiss
Jamie Theiss is a full-time trader who daytrades stocks, swing trades forex, and from time to time position trades commodities.
PRINT THIS ARTICLE
DAY TRADING
Bottoming Tailbar As A Classic Reversal Pattern
07/21/11 09:13:02 AMby Jamie Theiss
Why the bottoming tailbar is such a powerful reversal signal.
Position: Buy
| About a month ago, I wrote an article titled "Two Reasons To Buy The USD/JPY." I showed a bottoming tailbar reversal pattern based on the daily chart for a swing trade. This time, I will show how the same pattern, based on the five- and 15-minute charts, are just as effective for daytrading. I took my initial entry based off the five-minute chart, but the 15-minute chart is what gave me the confidence to increase my share size, and where the real power of this move is best demonstrated. |

|
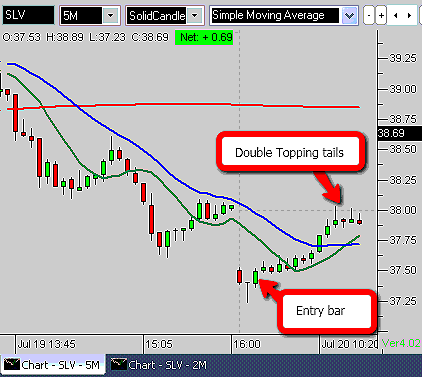
| FIGURE 1: SLV, FIVE-MINUTE |
| Graphic provided by: Blackwood Pro. |
| |
| Looking at the five-minute chart of SLV (iShares Silver Trust), you can see where my initial entry was taken at $37.41, when the bottom tailbar's high of $37.40 was taken out. My stop is placed one cent below the low of the bottom tailbar at $37.22. That gives me a 19-cent risk on this trade. Assuming a $100 risk amount per trade, I can buy 530 shares, which I round down to 500 shares to keep an even lot size and to account for slippage and trade costs (0.19 times 500 equals $95). My initial target is the area of the whole number of $38, which is also the prior day's close. See Figure 1. |

|
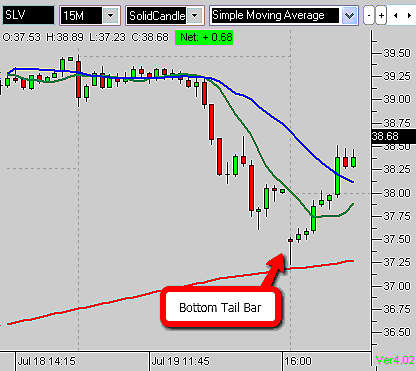
| FIGURE 2: SLV, 15-MINUTE. Bottom tailbar bouncing off a 200-period SMA (red) and far from the 20-period SMA (blue) is a powerful reversal signal. |
| Graphic provided by: Blackwood Pro. |
| |
| Now let's look at the 15-minute chart (Figure 2). This is where the reversal signal is more clearly defined. See how the bottom tailbar is far from the 20-period simple moving average (SMA) blue line. In addition, see how the bar, at its low, is bouncing off the 200-period SMA (red). What this shows so clearly is a bearish gap down on the open and a bearish red bar bouncing off major support, which completely reverses the bearishness. It shows a major capitulation of the bears and a definite change in sentiment over to the bullish side. Remember, large bars and bars that show major change are not made by retail traders like you and me; they are only made by large institutions. What I try to do is ride the coattails of the major players, and this bottom tailbar is a definite indicator of which way the majors are moving. |
| This pattern is so powerful that it gave me the confidence to add to my position when the 15-minute bottom tailbar's high of $37.53 is taken out. I added another 300 shares at $37.54, which brings my total share size to 800 shares, at an average cost of $37.46. I also move my stop to $37.35, which is one cent below the initial entry bar. Now I have an 11-cent risk on 800 shares, which reduces my risk on this trade from $95 to $88. So I have added share size while reducing the initial risk. This is how to really turbocharge your profits. |
| Looking back at the five-minute chart, you see my initial profit target is reached, and I take half my position off at $37.98 when a topping tail forms and the price comes back under the whole number. When the second topping tail forms a lower high and again comes back under the whole number, I take the last half off at $37.90, which is also a break of the five-minute low of the previous bar. This leaves me with $384 profit which, divided by the risk of $85, gives me a 4.5-to-1 reward-risk trade. Very nice. |
Jamie Theiss is a full-time trader who daytrades stocks, swing trades forex, and from time to time position trades commodities.
| E-mail address: | jamie_theiss@yahoo.com |
Click here for more information about our publications!
Comments

Request Information From Our Sponsors
- StockCharts.com, Inc.
- Candle Patterns
- Candlestick Charting Explained
- Intermarket Technical Analysis
- John Murphy on Chart Analysis
- John Murphy's Chart Pattern Recognition
- John Murphy's Market Message
- MurphyExplainsMarketAnalysis-Intermarket Analysis
- MurphyExplainsMarketAnalysis-Visual Analysis
- StockCharts.com
- Technical Analysis of the Financial Markets
- The Visual Investor
- VectorVest, Inc.
- Executive Premier Workshop
- One-Day Options Course
- OptionsPro
- Retirement Income Workshop
- Sure-Fire Trading Systems (VectorVest, Inc.)
- Trading as a Business Workshop
- VectorVest 7 EOD
- VectorVest 7 RealTime/IntraDay
- VectorVest AutoTester
- VectorVest Educational Services
- VectorVest OnLine
- VectorVest Options Analyzer
- VectorVest ProGraphics v6.0
- VectorVest ProTrader 7
- VectorVest RealTime Derby Tool
- VectorVest Simulator
- VectorVest Variator
- VectorVest Watchdog
