HOT TOPICS LIST
- MACD
- Fibonacci
- RSI
- Gann
- ADXR
- Stochastics
- Volume
- Triangles
- Futures
- Cycles
- Volatility
- ZIGZAG
- MESA
- Retracement
- Aroon
INDICATORS LIST
LIST OF TOPICS
PRINT THIS ARTICLE
by Mike Carr, CMT
Large daily swings in the major stock market indexes seem to be grabbing headlines, but indicators show volatility is unusually low.
Position: Buy
Mike Carr, CMT
Mike Carr, CMT, is a member of the Market Technicians Association, and editor of the MTA's newsletter, Technically Speaking. He is also the author of "Smarter Investing in Any Economy: The Definitive Guide to Relative Strength Investing," and "Conquering the Divide: How to Use Economic Indicators to Catch Stock Market Trends."
PRINT THIS ARTICLE
BOLLINGER BANDS
Volatility In The News, But Not The Market
07/21/11 09:01:52 AMby Mike Carr, CMT
Large daily swings in the major stock market indexes seem to be grabbing headlines, but indicators show volatility is unusually low.
Position: Buy
| Bollinger Bands are a very useful technical tool, commonly applied to price. They are the most best-known and most widely followed indicator developed by rational analyst John Bollinger, but they are far from the only tools developed by this market legend. Rational analysis itself is one of his tools, where he advocates combining technical and fundamental analysis to look for winners in the markets. Bollinger points out that limiting oneself to a particular data set is not the best way to maximize gains. |
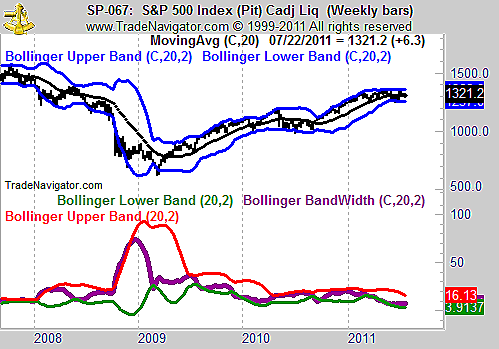
| Bollinger BandWidth can be used to measure volatility in the markets. This indicator looks at the distance between the bands. Bollinger Bands can be overlaid on bandwidth to help answer the question of whether volatility is high or low. This is shown in Figure 1, where we can see that the volatility on the weekly chart of Standard & Poor's 500 futures is low by recent standards. |

|
| FIGURE 1: S&P 500, WEEKLY. The Bollinger BandWidth is shown with Bollinger Bands to highlight the low volatility that has accompanied recent price action in the S&P 500. |
| Graphic provided by: Trade Navigator. |
| |
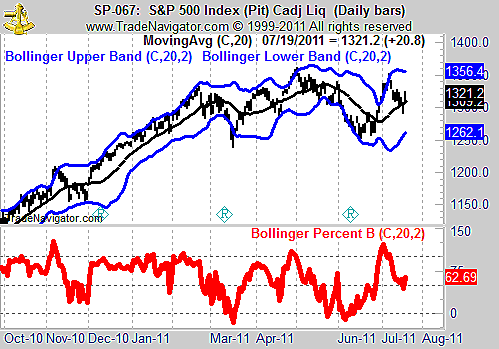
| Volatility is cyclical and tends to expand after it contracts. Another tool developed by Bollinger, the Bollinger Percent B, can help spot the direction of the price trend. This is shown in Figure 2, a daily chart of the S&P 500 futures contract. Percent B measures where price is in relation to the Bollinger Bands. It is useful for spotting confirmation, or divergence. |

|
| FIGURE 2: S&P 500, DAILY. The new high in price was confirmed by a new high in %b. |
| Graphic provided by: Trade Navigator. |
| |
| In Figure 2, we see that the indicator is confirming the recent high in price. Based solely on these charts, there is no reason to expect a sustained selloff in the S&P 500. Prices are in a trading range, where large daily moves have become fairly common, but the range is relatively small and well defined. A breakout in either direction is likely to see followthrough, and an upward breakout is probably more likely. |
Mike Carr, CMT, is a member of the Market Technicians Association, and editor of the MTA's newsletter, Technically Speaking. He is also the author of "Smarter Investing in Any Economy: The Definitive Guide to Relative Strength Investing," and "Conquering the Divide: How to Use Economic Indicators to Catch Stock Market Trends."
| Website: | www.moneynews.com/blogs/MichaelCarr/id-73 |
| E-mail address: | marketstrategist@gmail.com |
Click here for more information about our publications!
PRINT THIS ARTICLE

Request Information From Our Sponsors
- VectorVest, Inc.
- Executive Premier Workshop
- One-Day Options Course
- OptionsPro
- Retirement Income Workshop
- Sure-Fire Trading Systems (VectorVest, Inc.)
- Trading as a Business Workshop
- VectorVest 7 EOD
- VectorVest 7 RealTime/IntraDay
- VectorVest AutoTester
- VectorVest Educational Services
- VectorVest OnLine
- VectorVest Options Analyzer
- VectorVest ProGraphics v6.0
- VectorVest ProTrader 7
- VectorVest RealTime Derby Tool
- VectorVest Simulator
- VectorVest Variator
- VectorVest Watchdog
- StockCharts.com, Inc.
- Candle Patterns
- Candlestick Charting Explained
- Intermarket Technical Analysis
- John Murphy on Chart Analysis
- John Murphy's Chart Pattern Recognition
- John Murphy's Market Message
- MurphyExplainsMarketAnalysis-Intermarket Analysis
- MurphyExplainsMarketAnalysis-Visual Analysis
- StockCharts.com
- Technical Analysis of the Financial Markets
- The Visual Investor
