HOT TOPICS LIST
- MACD
- Fibonacci
- RSI
- Gann
- ADXR
- Stochastics
- Volume
- Triangles
- Futures
- Cycles
- Volatility
- ZIGZAG
- MESA
- Retracement
- Aroon
INDICATORS LIST
LIST OF TOPICS
PRINT THIS ARTICLE
by David Penn
Let profits reign using this range-based trend reversal indicator.
Position: N/A
David Penn
Technical Writer for Technical Analysis of STOCKS & COMMODITIES magazine, Working-Money.com, and Traders.com Advantage.
PRINT THIS ARTICLE
MASS INDEX
Mass Index
03/29/02 02:09:49 PMby David Penn
Let profits reign using this range-based trend reversal indicator.
Position: N/A
| The Mass Index is the creation of Donald Dorsey who built in this indicator a method for determining when trends are likely to reverse. In a universe of indicators given to determining when trends are in place, the Mass Index is a helpful addition. Using exponential moving averages and daily price ranges, Dorsey's Mass Index increases as the range between highs and lows increases and decreases as the range between highs and lows decreases. Importantly, the Mass Index can be used for both trending and non-trending (trading range or consolidation range) markets to figure out when prices are likely to reverse direction. |
| The computation for the Mass Index is a bit more complex than many indicators. Fortunately, however, most advanced charting programs feature a customizable Mass Index among the choices of indicators. For those interested in the actual Mass Index equation, that equation is provided below: Sum of value over N periods of [9-day exponential moving average of (high - low) / 9-day exponential moving average of a 9-day exponential moving average of (high - low)] In other words, first derive a 9-day exponential moving average of the difference between high and low prices over a given period. Second, calculate a 9-day exponential moving average of the initial 9-day exponential moving average. Third, divide the first moving average by the "moving average of the moving average" computed in the second step. Finally, add the values from step three for the number of periods being considered (the "N periods" in the equation above). As you might imagine, it is more helpful to simply let your charting software (or online service) do most of the heavy lifting to arrive at your "sum of values." With regard to the period length, 25 periods (usually days) is a widely used default setting. |

|
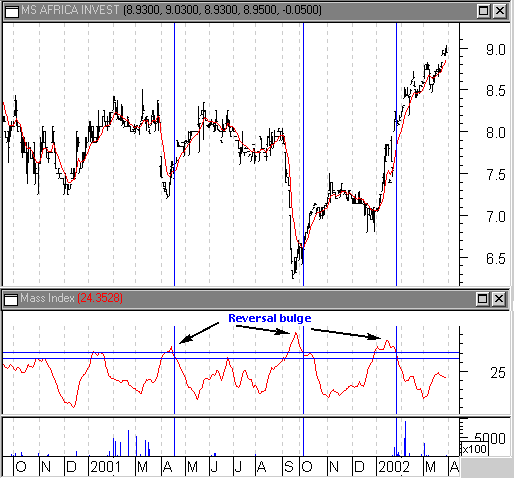
| "Reversal bulges" provide for three different Mass Index-based trading opportunities. |
| Graphic provided by: MetaStock. |
| |
| How is the Mass Index used? Dorsey suggested a particular phenomenon called the "reversal bulge." Steven Achelis, in his book "Technical Analysis from A to Z," describes Dorsey's reversal bulge as indicator movement in which the Mass Index rises above 27 and then falls below 26.5. Additionally, Achelis mentions that Dorsey used a 9-day exponential moving average (the fourth such moving average required by this indicator) in order to determine with some specificity whether or not the price action was trending upward or downward. When prices were above the 9-day EMA when a Mass Index signal is given--the reversal bulge--the signal was considered a long. When prices were below the 9-day EMA when the Mass Index signal arrived, the signal was considered a short. |
| Consider this chart of the closed-end fund, AFF, the Morgan Stanley Africa Investment Fund. Applying both the Mass Index and the 9-day exponential moving average to the AFF, we note three different signals. The first signal comes in April 2001, after the AFF had fallen almost 12%. The Mass Index makes its reversal bulge from April 5 to April 16. On April 16, the AFF was trading at 7.6. In a month, AFF was up to 8.1, a 6.5% increase. An even larger reversal bulge comes in the wake of the September 2001 collapse in AFF. The indicator gives its signal on October 4 with the AFF trading at 6.6. Thirty days later, the AFF was at 7.4, a 12% increase. Lastly, the Mass Index signal from January 28 (AFF at 8.14) provided for a long trade that, one month later at 8.58, was up 5.5% |
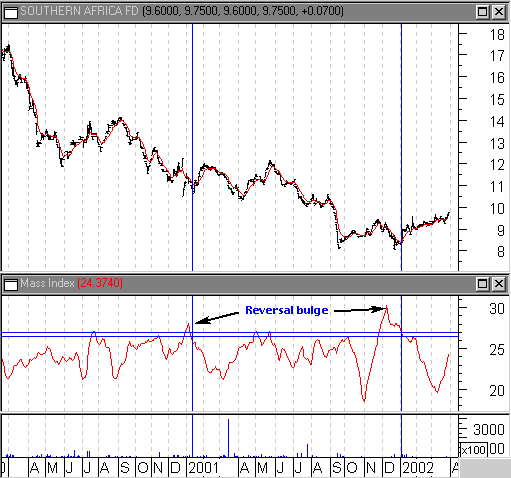
 The sizeable reversal bulge at the end of 2001 looks to have come at the bottom of this bear market. The Southern Africa Fund (SOA) had only two Mass Index based trading signals during the same period. The first reversal bulge came in January 2001, with the SOA trading at 11. A month later, SOA was up 6.6% at 11.73. This particular long opportunity (recall that the decision to go long or short is based on the 9-day EMA plotted directly on the price action under analysis, with the Mass Index providing the initial price reversal alert) was relatively short-lived. Given the countertrend nature of the long signal, this may be less of a surprise. A later reversal bulge began December 2001 and provided a signal at the beginning of January 2002. With the SOA trading at 8.3 in January, this long was up more than 10% in one month's time. Obviously those trading based on the Mass Index need to develop separate exit signals to get out of trades. The 30-day rule applied in these examples is intended simply to show that the profitability of these trades is not fleeting. Traders are encouraged to use trailing stops or other stop-loss strategies as an accompaniment to using the Mass Index to enter trades. A note on the examples: Both AFF and SOA are closed-end funds (CEFs) that invest in the equities of African companies (particularly Southern Africa in the case of SOA). Both are also currently trading at relevant discounts to their net asset value (NAV). Those unfamiliar with closed-end funds should know at least that closed-end funds that are appreciating in price AND selling at a discount represent a compelling buy opportunity compared to CEFs that may be appreciating but are already trading at a premium to their NAV. For example, the AFF has a five-year average discount of 22.21% and a year-to-date average discount of 4.41%. The current discount is less than one, at 0.55. An even bigger bargain may be the SOA. The SOA has a five-year average discount of 20.56 and a year-to-date average discount of 14.42. With a current discount of 11.03, the SOA has plenty of room to appreciate in value before becoming evenly valued, to say nothing of demanding a premium. |
Technical Writer for Technical Analysis of STOCKS & COMMODITIES magazine, Working-Money.com, and Traders.com Advantage.
| Title: | Technical Writer |
| Company: | Technical Analysis, Inc. |
| Address: | 4757 California Avenue SW |
| Seattle, WA 98116 | |
| Phone # for sales: | 206 938 0570 |
| Fax: | 206 938 1307 |
| Website: | www.Traders.com |
| E-mail address: | DPenn@traders.com |
Traders' Resource Links | |
| Charting the Stock Market: The Wyckoff Method -- Books | |
| Working-Money.com -- Online Trading Services | |
| Traders.com Advantage -- Online Trading Services | |
| Technical Analysis of Stocks & Commodities -- Publications and Newsletters | |
| Working Money, at Working-Money.com -- Publications and Newsletters | |
| Traders.com Advantage -- Publications and Newsletters | |
| Professional Traders Starter Kit -- Software | |
Click here for more information about our publications!
Comments
Date: 04/21/02Rank: 4Comment:

|

Request Information From Our Sponsors
- VectorVest, Inc.
- Executive Premier Workshop
- One-Day Options Course
- OptionsPro
- Retirement Income Workshop
- Sure-Fire Trading Systems (VectorVest, Inc.)
- Trading as a Business Workshop
- VectorVest 7 EOD
- VectorVest 7 RealTime/IntraDay
- VectorVest AutoTester
- VectorVest Educational Services
- VectorVest OnLine
- VectorVest Options Analyzer
- VectorVest ProGraphics v6.0
- VectorVest ProTrader 7
- VectorVest RealTime Derby Tool
- VectorVest Simulator
- VectorVest Variator
- VectorVest Watchdog
- StockCharts.com, Inc.
- Candle Patterns
- Candlestick Charting Explained
- Intermarket Technical Analysis
- John Murphy on Chart Analysis
- John Murphy's Chart Pattern Recognition
- John Murphy's Market Message
- MurphyExplainsMarketAnalysis-Intermarket Analysis
- MurphyExplainsMarketAnalysis-Visual Analysis
- StockCharts.com
- Technical Analysis of the Financial Markets
- The Visual Investor
