HOT TOPICS LIST
- MACD
- Fibonacci
- RSI
- Gann
- ADXR
- Stochastics
- Volume
- Triangles
- Futures
- Cycles
- Volatility
- ZIGZAG
- MESA
- Retracement
- Aroon
INDICATORS LIST
LIST OF TOPICS
PRINT THIS ARTICLE
by Donald W. Pendergast, Jr.
Once an uptrend is officially reversed, wise traders will want to look for advantageous places to trade from the short side.
Position: N/A
Donald W. Pendergast, Jr.
Donald W. Pendergast is a financial markets consultant who offers specialized services to stock brokers and high net worth individuals who seek a better bottom line for their portfolios.
PRINT THIS ARTICLE
AROON
ACE Heading Into A Hole?
07/20/11 09:19:48 AMby Donald W. Pendergast, Jr.
Once an uptrend is officially reversed, wise traders will want to look for advantageous places to trade from the short side.
Position: N/A
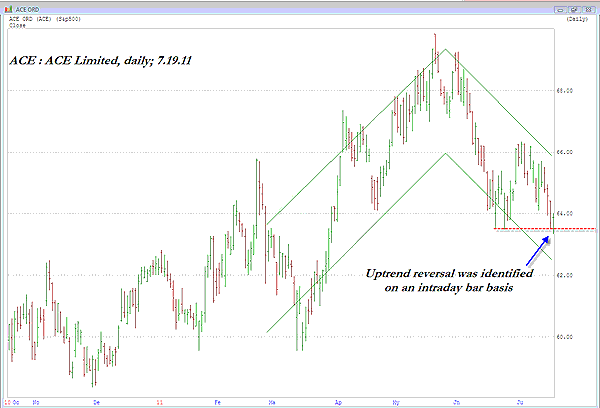
| Using TimBukOne's Advanced Pattern Recognition software (end of day version) to identify a variety of reversal patterns after the close of trading on Tuesday, July 19, I was able to locate several setups of interest. The daily chart of ACE Ltd. (ACE) came through with a very interesting uptrend reversal pattern with a rating of 100. Let's have a closer look now. |

|
| FIGURE 1: ACE, DAILY. Although the reversal won't be official until the recent swing low is exceeded on a closing basis, the TimBukOne Advanced Chart Pattern Recognition software appears to do an excellent job of identifying specific technical setups. In this case, it's an uptrend reversal. |
| Graphic provided by: TimBukOne's Advanced Chart Pattern Recognition. |
| |
| The daily chart of ACE (Figure 1) comes up within the TimBukOne software already plotted with the appropriate channel, trend and/or support lines already plotted; in this case, we see that the software has identified an uptrend reversal on an intraday bar basis, meaning that the software "noticed" that the prior swing low was exceeded during Tuesday's trading session. Whether that swing low will be taken out on a closing basis soon is anyone's guess, but you can be sure that a lot of eyes will be fixed on that price area for the next few sessions. |

|
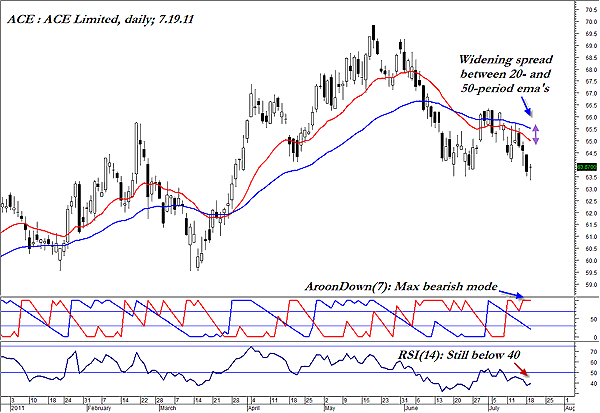
| FIGURE 2: ACE, DAILY. With the AroonDown(7) in full bearish trim and downside momentum increasing, all eyes will be focusing on the $63.35 to $63.50 price support level in this stock. |
| Graphic provided by: MetaStock. |
| |
| Moving over to the MetaStock Aroon template that I designed a few years ago, we also find plenty of evidence to suggest that ACE may be more likely to see more downside price action before it sees a sustained rebound; the seven-period AroonDown indicator (red part of Aroon histogram at the bottom of the chart) has reached its maximum bearish reading of 100, the relative strength indicator (RSI)(14)is still below 40, and the spread between the 20- and 50-period exponential moving averages (EMAs) is starting to expand. See Figure 2. |
| Wise traders will want to monitor the strength (weakness) of the broad market as they consider how to best position themselves to trade ACE; one of the better ways might be to wait for a sustained intraday rally to key moving average, Fibonacci, or floor pivot resistance levels before attempting to go short, and only after you see the key swing low price of $63.50 blown out on strong volume. At the very least, having two unique technical software tools to help you interpret and identify potential trading setups might give you some additional confidence before plunging into the world of stock, forex, and futures trading. Learn to use them wisely, in ways that fit well with your own trading temperament. |
Donald W. Pendergast is a financial markets consultant who offers specialized services to stock brokers and high net worth individuals who seek a better bottom line for their portfolios.
| Title: | Writer, market consultant |
| Company: | Linear Trading Systems LLC |
| Jacksonville, FL 32217 | |
| Phone # for sales: | 904-239-9564 |
| E-mail address: | lineartradingsys@gmail.com |
Traders' Resource Links | |
| Linear Trading Systems LLC has not added any product or service information to TRADERS' RESOURCE. | |
Click here for more information about our publications!
PRINT THIS ARTICLE

Request Information From Our Sponsors
- StockCharts.com, Inc.
- Candle Patterns
- Candlestick Charting Explained
- Intermarket Technical Analysis
- John Murphy on Chart Analysis
- John Murphy's Chart Pattern Recognition
- John Murphy's Market Message
- MurphyExplainsMarketAnalysis-Intermarket Analysis
- MurphyExplainsMarketAnalysis-Visual Analysis
- StockCharts.com
- Technical Analysis of the Financial Markets
- The Visual Investor
- VectorVest, Inc.
- Executive Premier Workshop
- One-Day Options Course
- OptionsPro
- Retirement Income Workshop
- Sure-Fire Trading Systems (VectorVest, Inc.)
- Trading as a Business Workshop
- VectorVest 7 EOD
- VectorVest 7 RealTime/IntraDay
- VectorVest AutoTester
- VectorVest Educational Services
- VectorVest OnLine
- VectorVest Options Analyzer
- VectorVest ProGraphics v6.0
- VectorVest ProTrader 7
- VectorVest RealTime Derby Tool
- VectorVest Simulator
- VectorVest Variator
- VectorVest Watchdog
