HOT TOPICS LIST
- MACD
- Fibonacci
- RSI
- Gann
- ADXR
- Stochastics
- Volume
- Triangles
- Futures
- Cycles
- Volatility
- ZIGZAG
- MESA
- Retracement
- Aroon
INDICATORS LIST
LIST OF TOPICS
PRINT THIS ARTICLE
by David Penn
Let "up" days and "down" days dictate market opportunities.
Position: N/A
David Penn
Technical Writer for Technical Analysis of STOCKS & COMMODITIES magazine, Working-Money.com, and Traders.com Advantage.
PRINT THIS ARTICLE
MOMENTUM
Intraday Momentum Index
03/28/02 01:55:09 PMby David Penn
Let "up" days and "down" days dictate market opportunities.
Position: N/A
| Introduced by Tushar Chande in his book, "The New Technical Trader," the Intraday Momentum Index (IMI) combines the much-maligned Relative Strength Index (RSI) with Japanese candlestick analysis techniques. While apparently a strange combination, the resulting indicator, IMI, is a powerful tool for finding optimal buying and selling days based on the signals provided by individual days. |
| The Relative Strength Index (RSI), developed by Welles Wilder in 1978, considers the relationship between "up closes" and "down closes" over a range of price action, often day-to-day. The RSI is an overbought/oversold indicator. A steadily increasing series of "up closes" increases the numerical ratio, which in this case would be interpreted as an increasingly overbought reading. Such a reading would warn the investor or trader that that prices were becoming overextended on the long side and may be due for a correction. Conversely, an increasing series of "down closes" decreases the ratio and suggests an increasingly oversold market. In this case, the trader or investor would be alerted to the fact that prices are becoming excessively low and that a buying opportunity may present itself in the short term. Readings of 70 are typically considered overbought on the RSI, with readings of 30 or below being considered oversold. |

|
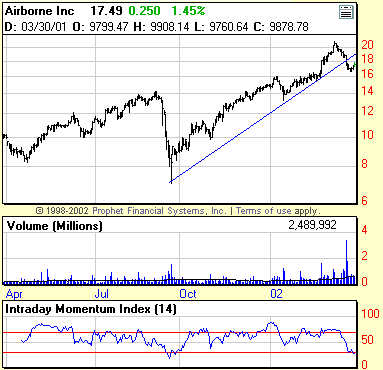
| An oversold IMI reading in a strong trend is often a sign of a buying opportunity. |
| Graphic provided by: ProphetFinance.. |
| |
| Chande's Intraday Momentum Index, on the other hand, considers the range of price action WITHIN a given period, usually a day. Instead of measuring the ratio between Day One (up close or down close) and Day Two (up close or down close) and so on, the Intraday Momentum Index considers the relationship between the open and the close of each day. This is where the Japanese candlestick aspect of the IMI comes into play, insofar as one of the breakthroughs of Japanese candlestick analysis was to return focus to the daily battles between buyers and sellers. |
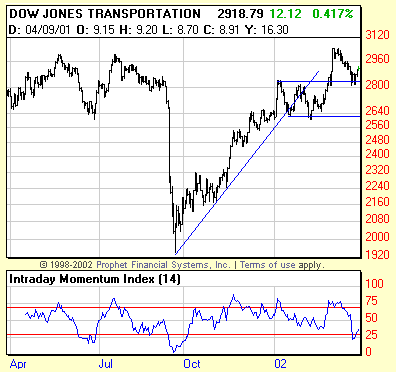
| The day is considered a "down" day for the purposes of the Intraday Momentum Index if the open of a given day is above the close. Should the open of a given day be below the close, then the day would be considered an "up" day. The formula for the Intraday Momentum Index is similar to the RSI formula. In the New Technical Trader, Chande writes it as such: IMI = [ISup/ISup + ISdown] * 100 Another way of looking at this equation is to say that the Intraday Momentum Index is the sum of "up" days divided by the sum of "up" days plus the sum of "down" days. This quotient is then multiplied by 100 to arrive at the IMI number, a number between 0 and 100. Like the Relative Strength Index, 70 is generally considered an overbought reading and 30 an oversold reading. The average days to be considered by the IMI can vary, although 14 days is a common period length. The example provided in the discussion of the Intraday Momentum Index brings to mind an interesting development in the Dow Transports, which are headed back up after selling off somewhat at the beginning of March.  The Dow Transports rally from an oversold reading in the IMI. |
| Note that here as well, the Intraday Momentum Index is showing the Transports as oversold. The last time the Dow Transports recorded a similarly low IMI reading was in the days immediately following the September 11th terrorist attacks in the United States. Before that, a sub-25 reading in late June suggested the last good buying opportunity before the fall break. The overbought reading in November was the one instance in which prices moved higher instead of lower in response to the IMI's suggestion that prices had become overextended. As the trendline shows, the Dow Transports had indeed become somewhat overextended as the Transports moved almost straight up in mid-November. However, the trendline would have also given traders and investors a sense of where the support was (about 2400) in the Transports' advance for those spooked by the IMI's overbought signal. Generally speaking, when prices are in a strong trend, overbought/oversold indicators will have a tendency to read consistently overbought if the trend is up and oversold if the trend is down. This means that there can be special opportunities when prices in an otherwise strong uptrend become oversold (usually because of a short-term correction) and dip lower. If prices find support--either against a trendline or on the back of a previous rally high or correction low--these oversold instances can be the optimal time for longs to enter an upwardly trending market. |
Technical Writer for Technical Analysis of STOCKS & COMMODITIES magazine, Working-Money.com, and Traders.com Advantage.
| Title: | Technical Writer |
| Company: | Technical Analysis, Inc. |
| Address: | 4757 California Avenue SW |
| Seattle, WA 98116 | |
| Phone # for sales: | 206 938 0570 |
| Fax: | 206 938 1307 |
| Website: | www.Traders.com |
| E-mail address: | DPenn@traders.com |
Traders' Resource Links | |
| Charting the Stock Market: The Wyckoff Method -- Books | |
| Working-Money.com -- Online Trading Services | |
| Traders.com Advantage -- Online Trading Services | |
| Technical Analysis of Stocks & Commodities -- Publications and Newsletters | |
| Working Money, at Working-Money.com -- Publications and Newsletters | |
| Traders.com Advantage -- Publications and Newsletters | |
| Professional Traders Starter Kit -- Software | |
Click here for more information about our publications!
Comments

Request Information From Our Sponsors
- StockCharts.com, Inc.
- Candle Patterns
- Candlestick Charting Explained
- Intermarket Technical Analysis
- John Murphy on Chart Analysis
- John Murphy's Chart Pattern Recognition
- John Murphy's Market Message
- MurphyExplainsMarketAnalysis-Intermarket Analysis
- MurphyExplainsMarketAnalysis-Visual Analysis
- StockCharts.com
- Technical Analysis of the Financial Markets
- The Visual Investor
- VectorVest, Inc.
- Executive Premier Workshop
- One-Day Options Course
- OptionsPro
- Retirement Income Workshop
- Sure-Fire Trading Systems (VectorVest, Inc.)
- Trading as a Business Workshop
- VectorVest 7 EOD
- VectorVest 7 RealTime/IntraDay
- VectorVest AutoTester
- VectorVest Educational Services
- VectorVest OnLine
- VectorVest Options Analyzer
- VectorVest ProGraphics v6.0
- VectorVest ProTrader 7
- VectorVest RealTime Derby Tool
- VectorVest Simulator
- VectorVest Variator
- VectorVest Watchdog
