HOT TOPICS LIST
- MACD
- Fibonacci
- RSI
- Gann
- ADXR
- Stochastics
- Volume
- Triangles
- Futures
- Cycles
- Volatility
- ZIGZAG
- MESA
- Retracement
- Aroon
INDICATORS LIST
LIST OF TOPICS
PRINT THIS ARTICLE
by Chaitali Mohile
The long-term bullish breakout rally of CHKP is likely to halt.
Position: N/A
Chaitali Mohile
Active trader in the Indian stock markets since 2003 and a full-time writer. Trading is largely based upon technical analysis.
PRINT THIS ARTICLE
TECHNICAL INDICATORS
CHKP Is Extremely Bullish
07/18/11 10:26:38 AMby Chaitali Mohile
The long-term bullish breakout rally of CHKP is likely to halt.
Position: N/A
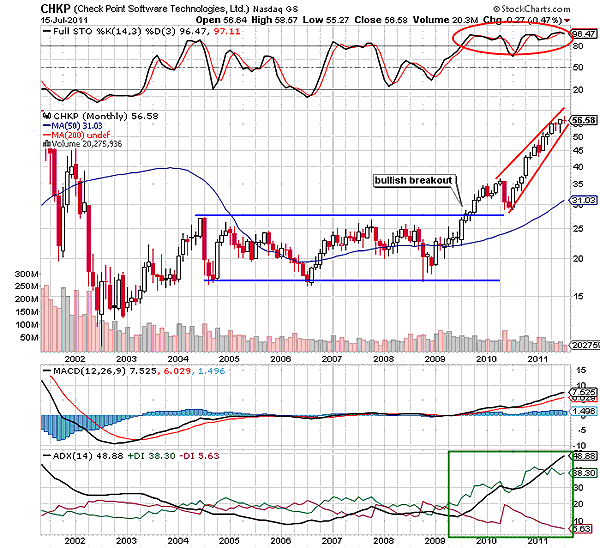
| Check Point Software Technologies Ltd. (CHKP) underwent a robust bullish breakout at $30 in late 2009. In a time span of a year and half, the stock gained 26 points. Initially, the breakout retraced to challenge the newly formed support of an upper consolidation range at the 26 levels. Since the stock had breached a four year consolidation range, the breakout was filled with strong bullish force. Therefore, CHKP soon resumed its bullish path. The full stochastic (14,3,3) formed higher lows, indicating a developing bullish momentum during the price breakout. Gradually, the oscillator surged above 50 levels, as the stock gained strength. From Figure 1 you can see that the average directional index (ADX) (14) has always been weaker. The trend failed to move above 20 levels, and the selling as well buying witnessed equal pressure. As a result, the trend could not develop. |

|
| FIGURE 1: CHKP, MONTHLY. The rising wedge and the extremely bullish indicator are likely to drag down the stock. |
| Graphic provided by: StockCharts.com. |
| |
| The moving average convergence/divergence (MACD) (12,26,9) was stuck at the center line of the oscillator. We can see in Figure 1 that the MACD line, trigger line, and the center line pretty much coincided for the entire four year consolidation period. The breakout changed the big picture of CHKP. All the three oscillators on the monthly chart surged into the bullish zone, resulting in the strong bullish breakout of CHKP. Many traders and investors might have grabbed this opportunity to trigger the long positions. Looking at the current levels of CHKP, those traders would have pockets full of attractive profits. However, it's time for them to book their partial profits and stand on the sidelines, as the stock has turned extremely bullish. The price rally has formed a rising wedge in Figure 1, signifying a bearish breakout for the stock. |
| The rising wedge is a bearish reversal formation, the stochastic oscillator of CHKP is highly overbought and the uptrend is overheated at 48 levels. Considering these conditions, the bullish rally could terminate for a while. The stock is likely to undergo a technical correction that would definitely drag the oscillators to healthy levels. The bearish rally would not dilute the bullish sentiments, but the stock would once again resume its upward journey. Meanwhile, the oscillator would also hit the bullish zone, which can initiate the bullish rally. Therefore, the short bearish phase would not wipe out the bullishness of CHKP. The stock would remain one of my favorites. |
Active trader in the Indian stock markets since 2003 and a full-time writer. Trading is largely based upon technical analysis.
| Company: | Independent |
| Address: | C1/3 Parth Indraprasth Towers. Vastrapur |
| Ahmedabad, Guj 380015 | |
| E-mail address: | chaitalimohile@yahoo.co.in |
Traders' Resource Links | |
| Independent has not added any product or service information to TRADERS' RESOURCE. | |
Click here for more information about our publications!
PRINT THIS ARTICLE

Request Information From Our Sponsors
- StockCharts.com, Inc.
- Candle Patterns
- Candlestick Charting Explained
- Intermarket Technical Analysis
- John Murphy on Chart Analysis
- John Murphy's Chart Pattern Recognition
- John Murphy's Market Message
- MurphyExplainsMarketAnalysis-Intermarket Analysis
- MurphyExplainsMarketAnalysis-Visual Analysis
- StockCharts.com
- Technical Analysis of the Financial Markets
- The Visual Investor
- VectorVest, Inc.
- Executive Premier Workshop
- One-Day Options Course
- OptionsPro
- Retirement Income Workshop
- Sure-Fire Trading Systems (VectorVest, Inc.)
- Trading as a Business Workshop
- VectorVest 7 EOD
- VectorVest 7 RealTime/IntraDay
- VectorVest AutoTester
- VectorVest Educational Services
- VectorVest OnLine
- VectorVest Options Analyzer
- VectorVest ProGraphics v6.0
- VectorVest ProTrader 7
- VectorVest RealTime Derby Tool
- VectorVest Simulator
- VectorVest Variator
- VectorVest Watchdog
