HOT TOPICS LIST
- MACD
- Fibonacci
- RSI
- Gann
- ADXR
- Stochastics
- Volume
- Triangles
- Futures
- Cycles
- Volatility
- ZIGZAG
- MESA
- Retracement
- Aroon
INDICATORS LIST
LIST OF TOPICS
PRINT THIS ARTICLE
by Koos van der Merwe
The US stock market is being influenced by Europe and by the Republicans preparing for a Presidential election.
Position: Accumulate
Koos van der Merwe
Has been a technical analyst since 1969, and has worked as a futures and options trader with First Financial Futures in Johannesburg, South Africa.
PRINT THIS ARTICLE
ELLIOTT WAVE
A Count For NASDAQ
07/18/11 10:09:18 AMby Koos van der Merwe
The US stock market is being influenced by Europe and by the Republicans preparing for a Presidential election.
Position: Accumulate
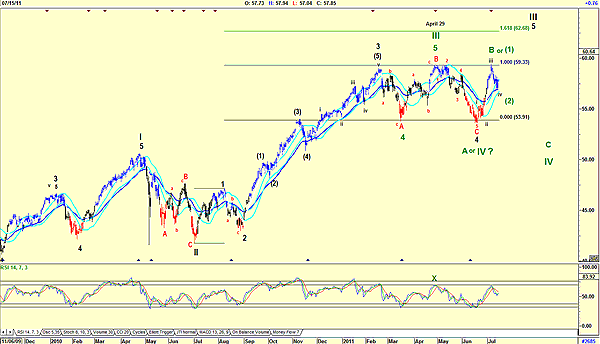
| The market is volatile at the moment. With events in Greece placing stress on the market, with the speculation that Italy, Portugal, or Ireland could default, with the possible breakup of the euro, with bears like Nouriel Roubini calling for a second recession, and with the Republican party trying to stalemate President Obama's planned economic recovery, does anybody other than traders want to risk their hard-earned money? Figure 1, of the QQQ, which follows the NASDAQ, shows two possible scenarios. The primary scenario is in black, the secondary in green. |

|
| FIGURE 1: QQQ, DAILY |
| Graphic provided by: AdvancedGET. |
| |
| Figure 1 shows my primary count in black, with wave III topping out at the 62.68 level (1.618 of wave I). This count suggests that wave 4 of wave III was a very complicated count, with the C wave of the A-B-C (red) bottoming at the 53.91 level. The Elliott rule, one should not forget, is that if a wave 2 is simple, wave 4 will be complicated, and vice versa. Looking at the chart, one can see that wave 2 of wave III was a simple a-b-c correction, which makes sense that wave 4 of wave III should be complicated, which the chart shows it is (black figures). Further, wave 4 of wave III did bottom with the fourth wave of lesser degree; it just made it breaking below the top of wave (3) of wave 3. With the third wave usually in the region of 1.618, a Fibonacci number of wave 1 of wave III, the target of 62.68 therefore does make sense. However, giving the bears their due, and knowing that the Republican party will shove as many boulders as they can in the road to economic recovery, my alternate count, in green, suggests that wave III topped out on April 29. With wave II being a very complicated ABC correction, it makes sense that wave IV should be a simple correction, or an even more complicated correction. The count in black figures shows an even more complicated correction. The figures in green are a simple correction. How will we know which count is correct? When the QQQ moves above the 59.33 resistance level and not break below the 53.91 support level. If the former, then the wave count shown in black is the correct count. If the latter, then the wave count shown in green is the correct count. There's a tough market ahead of us. The relative strength index (RSI), however, seems to favor the count in black count, but the sell signal at X where the RSI did not break above the 72 horizontal line suggests that another sell signal may have been given. |
Has been a technical analyst since 1969, and has worked as a futures and options trader with First Financial Futures in Johannesburg, South Africa.
| Address: | 3256 West 24th Ave |
| Vancouver, BC | |
| Phone # for sales: | 6042634214 |
| E-mail address: | petroosp@gmail.com |
Click here for more information about our publications!
PRINT THIS ARTICLE

|

Request Information From Our Sponsors
- StockCharts.com, Inc.
- Candle Patterns
- Candlestick Charting Explained
- Intermarket Technical Analysis
- John Murphy on Chart Analysis
- John Murphy's Chart Pattern Recognition
- John Murphy's Market Message
- MurphyExplainsMarketAnalysis-Intermarket Analysis
- MurphyExplainsMarketAnalysis-Visual Analysis
- StockCharts.com
- Technical Analysis of the Financial Markets
- The Visual Investor
- VectorVest, Inc.
- Executive Premier Workshop
- One-Day Options Course
- OptionsPro
- Retirement Income Workshop
- Sure-Fire Trading Systems (VectorVest, Inc.)
- Trading as a Business Workshop
- VectorVest 7 EOD
- VectorVest 7 RealTime/IntraDay
- VectorVest AutoTester
- VectorVest Educational Services
- VectorVest OnLine
- VectorVest Options Analyzer
- VectorVest ProGraphics v6.0
- VectorVest ProTrader 7
- VectorVest RealTime Derby Tool
- VectorVest Simulator
- VectorVest Variator
- VectorVest Watchdog
