HOT TOPICS LIST
- MACD
- Fibonacci
- RSI
- Gann
- ADXR
- Stochastics
- Volume
- Triangles
- Futures
- Cycles
- Volatility
- ZIGZAG
- MESA
- Retracement
- Aroon
INDICATORS LIST
LIST OF TOPICS
PRINT THIS ARTICLE
by Matt Blackman
In May, I discussed the value of Sotheby's as a bubble proxy. Here is a quick update.
Position: Sell
Matt Blackman
Matt Blackman is a full-time technical and financial writer and trader. He produces corporate and financial newsletters, and assists clients in getting published in the mainstream media. He is the host of TradeSystemGuru.com. Matt has earned the Chartered Market Technician (CMT) designation. Find out what stocks and futures Matt is watching on Twitter at www.twitter.com/RatioTrade
PRINT THIS ARTICLE
REVERSAL
Bubble Proxy Update
07/15/11 09:08:33 AMby Matt Blackman
In May, I discussed the value of Sotheby's as a bubble proxy. Here is a quick update.
Position: Sell
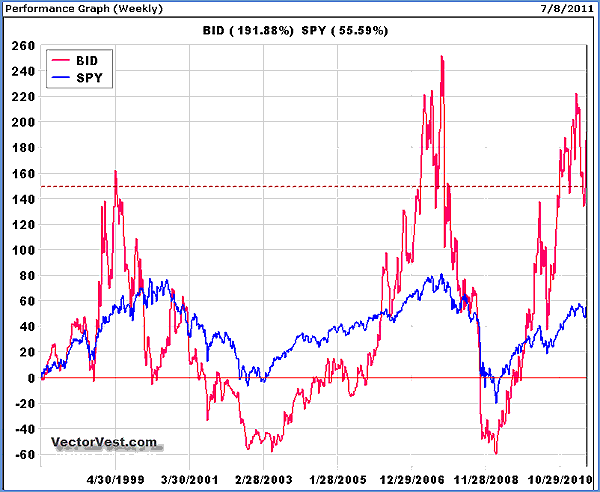
| It has been said that as an asset class, art can tell us much about animal spirits. When the art auction gavel continues to push prices to new all-time records, it usually means that the good times are about to come to an end. Take a look at a long-term chart of Sotheby's (BID), which went public in mid-1988, and you will see an interesting interplay between it and stocks. From its launch to its first peak in October 1989, the stock soared an incredible 352%, peaking two months before the Nikkei hit its all-time high, just shy of 40,000. See Figure 1. |

|
| FIGURE 1: BID VS. SPY. Here's a weekly performance chart comparing Sotheby’s (BID) with the S&P exchange traded fund [ETF] (SPY). Every time BID enjoyed a rise in excess of 150%, it presaged a peak in the SPY. |
| Graphic provided by: www.VectorVest.com. |
| |
| Its next supercharged trajectory saw it soar more than 165% from 1998 to April 1999, peaking nearly a year before the wider US stock market in March 2000. Between 2005 and October 2007, BID again shot for the moon, gaining 300% before crashing back to earth again, except this time its peak coincided with the peak in SPY. |
| Then from March 2009 to April 2011, BID gained an unprecedented 650% before rolling over again. And as we see in the chart, it is now well off its April high and looks locked in a downtrend. (This assumption is confirmed by negative divergence between BID and its relative strength index [RSI] over the last year or so.) |
| As the horizontal dashed red line shows, each time BID has jumped more than 150%, it has peaked and a big drop in both BID and SPY has ensued. There is no guarantee that BID won't reignite and head higher, but the probability for this sort of move on the heels of a 600+% jump is zero. |
| So how far behind is the Standard & Poor's 500 this time, given BID's past history as a bubble proxy, or could it be giving us a false signal? |
Matt Blackman is a full-time technical and financial writer and trader. He produces corporate and financial newsletters, and assists clients in getting published in the mainstream media. He is the host of TradeSystemGuru.com. Matt has earned the Chartered Market Technician (CMT) designation. Find out what stocks and futures Matt is watching on Twitter at www.twitter.com/RatioTrade
| Company: | TradeSystemGuru.com |
| Address: | Box 2589 |
| Garibaldi Highlands, BC Canada | |
| Phone # for sales: | 604-898-9069 |
| Fax: | 604-898-9069 |
| Website: | www.tradesystemguru.com |
| E-mail address: | indextradermb@gmail.com |
Traders' Resource Links | |
| TradeSystemGuru.com has not added any product or service information to TRADERS' RESOURCE. | |
Click here for more information about our publications!
PRINT THIS ARTICLE

Request Information From Our Sponsors
- StockCharts.com, Inc.
- Candle Patterns
- Candlestick Charting Explained
- Intermarket Technical Analysis
- John Murphy on Chart Analysis
- John Murphy's Chart Pattern Recognition
- John Murphy's Market Message
- MurphyExplainsMarketAnalysis-Intermarket Analysis
- MurphyExplainsMarketAnalysis-Visual Analysis
- StockCharts.com
- Technical Analysis of the Financial Markets
- The Visual Investor
- VectorVest, Inc.
- Executive Premier Workshop
- One-Day Options Course
- OptionsPro
- Retirement Income Workshop
- Sure-Fire Trading Systems (VectorVest, Inc.)
- Trading as a Business Workshop
- VectorVest 7 EOD
- VectorVest 7 RealTime/IntraDay
- VectorVest AutoTester
- VectorVest Educational Services
- VectorVest OnLine
- VectorVest Options Analyzer
- VectorVest ProGraphics v6.0
- VectorVest ProTrader 7
- VectorVest RealTime Derby Tool
- VectorVest Simulator
- VectorVest Variator
- VectorVest Watchdog
