HOT TOPICS LIST
- MACD
- Fibonacci
- RSI
- Gann
- ADXR
- Stochastics
- Volume
- Triangles
- Futures
- Cycles
- Volatility
- ZIGZAG
- MESA
- Retracement
- Aroon
INDICATORS LIST
LIST OF TOPICS
PRINT THIS ARTICLE
by Koos van der Merwe
We all know who Warren Buffett is, and we all respect him. Can his company Berkshire Hathway be used as a market leader?
Position: Accumulate
Koos van der Merwe
Has been a technical analyst since 1969, and has worked as a futures and options trader with First Financial Futures in Johannesburg, South Africa.
PRINT THIS ARTICLE
CHART ANALYSIS
Is Berkshire A Leader?
07/13/11 09:11:41 AMby Koos van der Merwe
We all know who Warren Buffett is, and we all respect him. Can his company Berkshire Hathway be used as a market leader?
Position: Accumulate
| When Warren Buffett opens his mouth to speak, the world listens. Last week, the famous bear Nouriel Roubini stated that he saw a major recession in the offing. A few days later, Warren Buffett stated that he does not see a major market meltdown in the future, but a buying opportunity. Both have a 50% chance of being correct, but I'm shuffling my cards with Warren Buffett. When Roubini is wrong, newscasts seem to forget he exists; when on the odd occasion he is correct, headlines splash. With Warren Buffett, headlines splash all over the world all the time when he speaks. Why? Because we can observe his performance by looking at the movement in the price of his company, Berkshire Hathaway. There is no chart on Roubini's performance. |

|
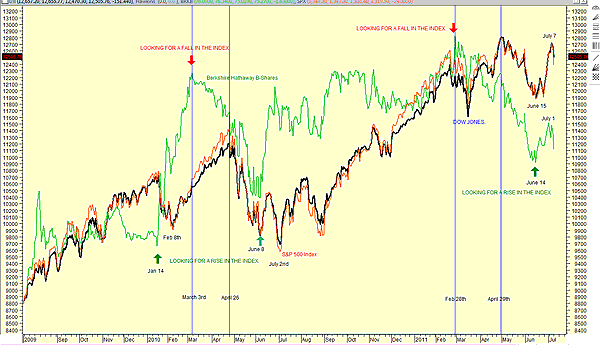
| FIGURE 1: DJIA, S&P 500, BERKSHIRE HATHAWAY. The DJIA and the S&P 500 are compared with Berkshire Hathaway B shares. |
| Graphic provided by: MetaStock. |
| |
| Figure 1 is a simple line chart of the Dow Jones Industrial Average (DJIA) (black line), the Standard & Poor's 500, (red line) and Berkshire Hathaway B (BRK'B) shares (green line). Note how Berkshire appears to lead both indexes. I have shown where Berkshire has suggested sell signals and buy signals. Note that in all cases there is approximately a two-month difference -- that is, Berkshire appears to lead the index by approximately two months when it comes to a fall but approximately one month for a rise. However, it is interesting to note that on June 14, Berkshire Hathaway gave a buy signal, with the DJIA and the S&P 500 rising on June 15. Do note that Berkshire Hathaway suggested weakness on July 1, ahead of both indexes. Can we use Berkshire Hathaway as an indicator of market performance? It does look like it, but the depth of the fall or rise should not be a consideration. |
Has been a technical analyst since 1969, and has worked as a futures and options trader with First Financial Futures in Johannesburg, South Africa.
| Address: | 3256 West 24th Ave |
| Vancouver, BC | |
| Phone # for sales: | 6042634214 |
| E-mail address: | petroosp@gmail.com |
Click here for more information about our publications!
PRINT THIS ARTICLE

Request Information From Our Sponsors
- VectorVest, Inc.
- Executive Premier Workshop
- One-Day Options Course
- OptionsPro
- Retirement Income Workshop
- Sure-Fire Trading Systems (VectorVest, Inc.)
- Trading as a Business Workshop
- VectorVest 7 EOD
- VectorVest 7 RealTime/IntraDay
- VectorVest AutoTester
- VectorVest Educational Services
- VectorVest OnLine
- VectorVest Options Analyzer
- VectorVest ProGraphics v6.0
- VectorVest ProTrader 7
- VectorVest RealTime Derby Tool
- VectorVest Simulator
- VectorVest Variator
- VectorVest Watchdog
- StockCharts.com, Inc.
- Candle Patterns
- Candlestick Charting Explained
- Intermarket Technical Analysis
- John Murphy on Chart Analysis
- John Murphy's Chart Pattern Recognition
- John Murphy's Market Message
- MurphyExplainsMarketAnalysis-Intermarket Analysis
- MurphyExplainsMarketAnalysis-Visual Analysis
- StockCharts.com
- Technical Analysis of the Financial Markets
- The Visual Investor
