HOT TOPICS LIST
- MACD
- Fibonacci
- RSI
- Gann
- ADXR
- Stochastics
- Volume
- Triangles
- Futures
- Cycles
- Volatility
- ZIGZAG
- MESA
- Retracement
- Aroon
INDICATORS LIST
LIST OF TOPICS
PRINT THIS ARTICLE
by Mike Carr, CMT
Fibonacci ratios have a mythical quality among many traders. Ten-year interest rates are a current example of Fibonacci retracements.
Position: Sell
Mike Carr, CMT
Mike Carr, CMT, is a member of the Market Technicians Association, and editor of the MTA's newsletter, Technically Speaking. He is also the author of "Smarter Investing in Any Economy: The Definitive Guide to Relative Strength Investing," and "Conquering the Divide: How to Use Economic Indicators to Catch Stock Market Trends."
PRINT THIS ARTICLE
FIBONACCI
Do Fibs Work?
07/13/11 09:02:35 AMby Mike Carr, CMT
Fibonacci ratios have a mythical quality among many traders. Ten-year interest rates are a current example of Fibonacci retracements.
Position: Sell
| Many traders believe that prices respect Fibonacci ratios. Prices tend to move in trends at times, but they don't move in a straight line. In an uptrend, prices endure brief downturns. These moves counter to the trend are called "retracements." Many traders look for retracements of price action to stop at Fib ratios. |
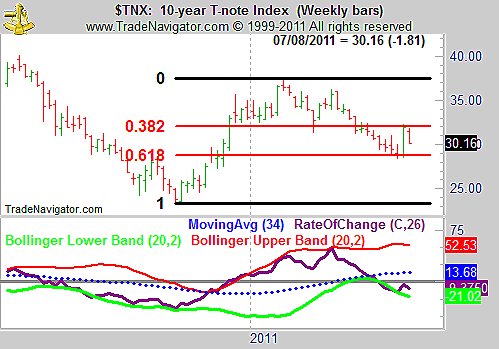
| Ten-year interest rates are shown in Figure 1. The 2010 low and 2011 high in rates are used to find the Fib levels. The initial decline stopped at 38.2% of the price rise. After that level was broken, the 61.8% Fibonacci ratio has offered support. |

|
| FIGURE 1: 10-YEAR T-NOTE INDEX, WEEKLY |
| Graphic provided by: Trade Navigator. |
| |
| For skeptics, there are many more examples of charts where Fibonacci ratios proved ineffective. Proponents often ignore that evidence. Some traders will be able to show profits with Fib ratios, but this is true of almost any technical tool. If Fib ratios are effective, then interest rates should fall from here, after reaching the upper Fibonacci resistance level. Or they may rise after testing support. Fibs can be interpreted in almost any manner. |
| Rate of change is also shown in the chart, and it shows a bullish divergence at the recent high and an oversold condition reached at the latest low. That would point to higher rates. Rates fell sharply when the June unemployment report was weaker than expected. If the economy turns down, rates will fall. If the report is an anomaly and the economy continues growing, then rates will rise. |
| Fundamentals do matter, and most economic data is showing slow growth, which means higher interest rates are more likely based on the fundamentals. The technicals are mixed, but rate of change is a more reliable indicator than Fib ratios, which only work once in a while. Barring economic collapse, rates should be testing their highs near 3.5% soon. |
Mike Carr, CMT, is a member of the Market Technicians Association, and editor of the MTA's newsletter, Technically Speaking. He is also the author of "Smarter Investing in Any Economy: The Definitive Guide to Relative Strength Investing," and "Conquering the Divide: How to Use Economic Indicators to Catch Stock Market Trends."
| Website: | www.moneynews.com/blogs/MichaelCarr/id-73 |
| E-mail address: | marketstrategist@gmail.com |
Click here for more information about our publications!
Comments

Request Information From Our Sponsors
- StockCharts.com, Inc.
- Candle Patterns
- Candlestick Charting Explained
- Intermarket Technical Analysis
- John Murphy on Chart Analysis
- John Murphy's Chart Pattern Recognition
- John Murphy's Market Message
- MurphyExplainsMarketAnalysis-Intermarket Analysis
- MurphyExplainsMarketAnalysis-Visual Analysis
- StockCharts.com
- Technical Analysis of the Financial Markets
- The Visual Investor
- VectorVest, Inc.
- Executive Premier Workshop
- One-Day Options Course
- OptionsPro
- Retirement Income Workshop
- Sure-Fire Trading Systems (VectorVest, Inc.)
- Trading as a Business Workshop
- VectorVest 7 EOD
- VectorVest 7 RealTime/IntraDay
- VectorVest AutoTester
- VectorVest Educational Services
- VectorVest OnLine
- VectorVest Options Analyzer
- VectorVest ProGraphics v6.0
- VectorVest ProTrader 7
- VectorVest RealTime Derby Tool
- VectorVest Simulator
- VectorVest Variator
- VectorVest Watchdog
