HOT TOPICS LIST
- MACD
- Fibonacci
- RSI
- Gann
- ADXR
- Stochastics
- Volume
- Triangles
- Futures
- Cycles
- Volatility
- ZIGZAG
- MESA
- Retracement
- Aroon
INDICATORS LIST
LIST OF TOPICS
PRINT THIS ARTICLE
by Chaitali Mohile
The price chart of the London Financial Times shows that the index has lost most of its bullish strength in recent rallies. How long will the bearish rally continue?
Position: N/A
Chaitali Mohile
Active trader in the Indian stock markets since 2003 and a full-time writer. Trading is largely based upon technical analysis.
PRINT THIS ARTICLE
TECHNICAL ANALYSIS
$FTSE Completely In Bear's Control
07/11/11 02:08:51 PMby Chaitali Mohile
The price chart of the London Financial Times shows that the index has lost most of its bullish strength in recent rallies. How long will the bearish rally continue?
Position: N/A
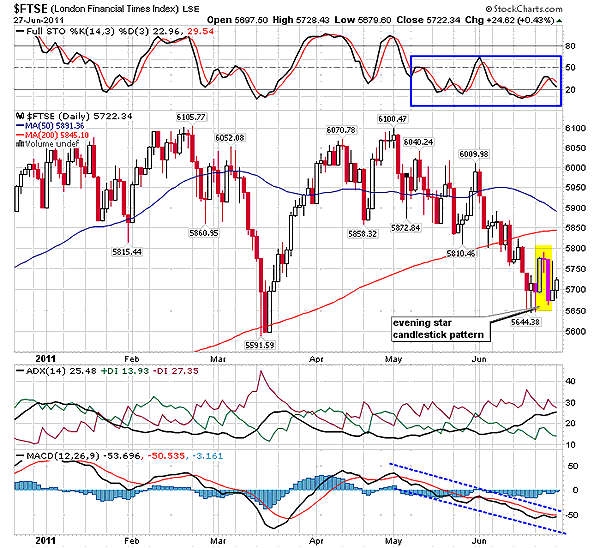
| The daily chart of the London Financial Times ($FTSE) in Figure 1 is filled with long red candles. Since early 2011, $FTSE has bounced back from 6100 levels, forming a robust resistance zone. The bears jumped in each time the index was challenging its resistance level. The 50-day moving average (MA) support was frequently threatened by the price rally. We can see the long lower shadows of the candles and other bearish candles (red) tangled near the support in Figure 1. Even though the MA support was completely breached only once, the index immediately regained its 50-day support in the next few sessions. During this short-term MA breakout, the 200-day moving average (MA) played a very important role by extending robust support to the price rally. As a result, the index could begin the pullback rally from 5591 levels. However, the declining 50-day MA support has forced the price action to descend as well. The converging 200-day MA and 50-day MA can undergo a bearish moving average cross in the future. |

|
| FIGURE 1: $FTSE, DAILY |
| Graphic provided by: StockCharts.com. |
| |
| Recently, both the MA supports have converted to resistance, plunging to 5650 levels. The index is trying to consolidate between the 5650 support and 5750 resistance levels. During consolidation, the index has formed an evening star candlestick pattern near the upper range (5750), signifying a bearish trend reversal rally. The three candlesticks marked in the yellow block shows the evening star candlestick -- a bearish reversal formation. All the three candles are long, covering the entire consolidation range (upper as well as lower range). The following candle with a long upper shadow and a small real body shows lack of bullish strength to sustain near the intra-day high in Figure 1. Therefore, the price chart is healthily bearish, reflecting some more downside for $FTSE. Notice the unstable average directional movement index (ADX) line. Although the selling pressure indicated by the negative directional index (-DI) of the ADX(14) was ruling the rally, the ADX line failed to sustain above 20 levels. |
| We can see in Figure 1 that the downtrend developed after breaching the 200-day MA support in June 2011. The ADX (14) surged above the 20 levels, indicating the developing bearish trend for $FTSE. The full stochastic (14,3,3) is trapped between 50 and 30 levels; the moving average convergence/divergence (MACD) (12,26,9) is completely negative. Both oscillators are suggesting weak momentum for the index. For undergoing a stable pullback rally from the current level, the indicators also have to surge in the bullish zone. In addition, the index has to convert the moving average resistance to support. |

|
| FIGURE 2: $FTSE, WEEKLY |
| Graphic provided by: StockCharts.com. |
| |
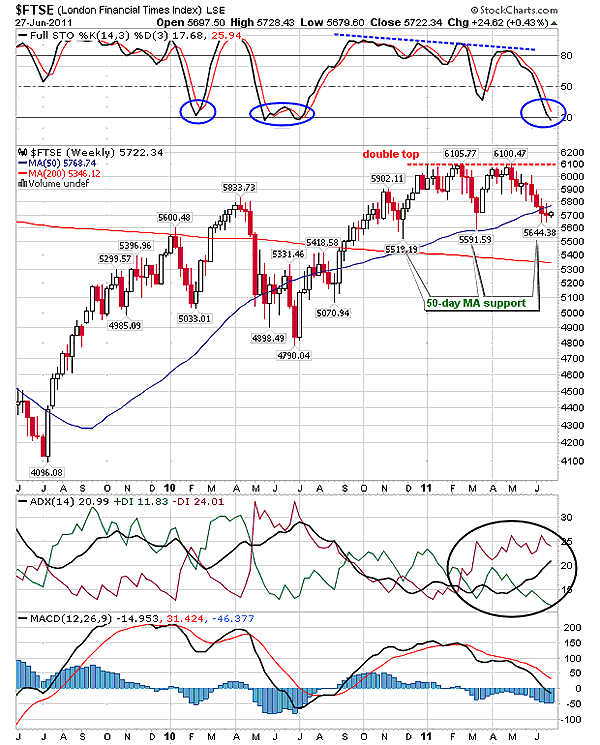
| $FTSE has formed a double-top formation on its weekly time frame in Figure 2. The peaks are formed at 6100/6105 levels in March and May 2011. The sharp valley between the two tops touched the 50-day MA support. During the bullish rally from 5400 levels, the short-term MA has been the strong support for the index. The long lower shadows of the candles tested the strength of the 50-day MA support, which helped the index to surge. Therefore, if the 50-day MA support is breached by the current bearish rally, the index would enter into an intermediate downtrend. |
| The double top is a bearish trend reversal formation. The index has already plunged 400 points from the top and is about to violate the 50-day MA support. The ADX (14) in Figure 2 is indicating the developing downtrend. The stochastic oscillator is ready to touch an oversold level, signifying more downside for the index. But we need to remember that earlier the oscillator had bounced with the support of 20 levels and pulled the price rally as well. Therefore, traders have to stay watchful at the current stage. The moving average convergence/divergence (MACD) (12,26,9) has formed a rounded top, showing a readiness to plunge in negative territory. The bearish rally of $FTSE has reached the crucial level. The charts are filled with negativity, which would harm the price rally. The 50-day MA support and the stochastic oscillator's reaction near the 20 levels are the shell of $FTSE. |
Active trader in the Indian stock markets since 2003 and a full-time writer. Trading is largely based upon technical analysis.
| Company: | Independent |
| Address: | C1/3 Parth Indraprasth Towers. Vastrapur |
| Ahmedabad, Guj 380015 | |
| E-mail address: | chaitalimohile@yahoo.co.in |
Traders' Resource Links | |
| Independent has not added any product or service information to TRADERS' RESOURCE. | |
Click here for more information about our publications!
PRINT THIS ARTICLE

Request Information From Our Sponsors
- StockCharts.com, Inc.
- Candle Patterns
- Candlestick Charting Explained
- Intermarket Technical Analysis
- John Murphy on Chart Analysis
- John Murphy's Chart Pattern Recognition
- John Murphy's Market Message
- MurphyExplainsMarketAnalysis-Intermarket Analysis
- MurphyExplainsMarketAnalysis-Visual Analysis
- StockCharts.com
- Technical Analysis of the Financial Markets
- The Visual Investor
- VectorVest, Inc.
- Executive Premier Workshop
- One-Day Options Course
- OptionsPro
- Retirement Income Workshop
- Sure-Fire Trading Systems (VectorVest, Inc.)
- Trading as a Business Workshop
- VectorVest 7 EOD
- VectorVest 7 RealTime/IntraDay
- VectorVest AutoTester
- VectorVest Educational Services
- VectorVest OnLine
- VectorVest Options Analyzer
- VectorVest ProGraphics v6.0
- VectorVest ProTrader 7
- VectorVest RealTime Derby Tool
- VectorVest Simulator
- VectorVest Variator
- VectorVest Watchdog
