HOT TOPICS LIST
- MACD
- Fibonacci
- RSI
- Gann
- ADXR
- Stochastics
- Volume
- Triangles
- Futures
- Cycles
- Volatility
- ZIGZAG
- MESA
- Retracement
- Aroon
INDICATORS LIST
LIST OF TOPICS
PRINT THIS ARTICLE
by Koos van der Merwe
The rule is that the price will always fall or rise to fill the gap.
Position: Hold
Koos van der Merwe
Has been a technical analyst since 1969, and has worked as a futures and options trader with First Financial Futures in Johannesburg, South Africa.
PRINT THIS ARTICLE
GAPS
Filling The Gap
07/11/11 08:59:25 AMby Koos van der Merwe
The rule is that the price will always fall or rise to fill the gap.
Position: Hold
| Thoratec is a company that develops advanced medical technology to improve patient survival. The California-based company employs 600 workers around the world. |

|
| FIGURE 1: THORATEC, DAILY |
| Graphic provided by: AdvancedGET. |
| |
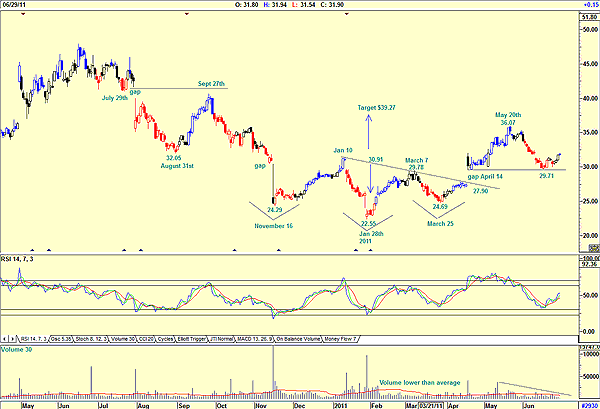
| Figure 1 is a good example of how a price will always rise or fall to fill a gap. On July 29, 2010, we can see how the price fell on a gap, bottoming at $32.05 by August 31. From that level, with the relative strength index (RSI) giving a buy signal, the price rose to fill the gap by September 27. From that level, on an RSI sell signal, it fell to $24.29 by November 16 once again on a gap, however small. The price then rose on an RSI buy signal to fill that gap by January 10, 2011. With the RSI giving a sell signal, the price then fell to $22.55 by January 10. On volume lower than average, the price rose to $29.78 by March 7, suggesting weakness, and as if to oblige, the price fell to a low of 24.69 by March 25. The RSI, however, did not give a sell signal, suggesting that the price could rise, which in fact it did, creating a gap on April 14 at $27.90. At the same time, the pattern formed was an inverse head & shoulders formation, suggesting a target of $39.27. The price rose to a high of $36.07 by May 20 and with the RSI giving a sell signal, and knowing that the price had to fall to fill the gap, we would have sold. The price did indeed fall to test the upper limit of the gap at $29.71 on falling volume, a sign of strength. From this level, the price rose with volume still falling, suggesting that the price could retest the $29.71 level. With the RSI not having given a true buy signal, and the gap tested but not filled, I would wait for a more definite buy signal. This is a stock that should be in your watchlist with a possible 20% profit should the price rise to the high of $39.27, the target of the inverse head & shoulder formation. |
Has been a technical analyst since 1969, and has worked as a futures and options trader with First Financial Futures in Johannesburg, South Africa.
| Address: | 3256 West 24th Ave |
| Vancouver, BC | |
| Phone # for sales: | 6042634214 |
| E-mail address: | petroosp@gmail.com |
Click here for more information about our publications!
Comments
Date: 07/17/11Rank: 4Comment:
Date: 07/19/11Rank: 4Comment: Enjoyed reading your article.
How do you find which stocks have gapped, early before the markets open

|

Request Information From Our Sponsors
- StockCharts.com, Inc.
- Candle Patterns
- Candlestick Charting Explained
- Intermarket Technical Analysis
- John Murphy on Chart Analysis
- John Murphy's Chart Pattern Recognition
- John Murphy's Market Message
- MurphyExplainsMarketAnalysis-Intermarket Analysis
- MurphyExplainsMarketAnalysis-Visual Analysis
- StockCharts.com
- Technical Analysis of the Financial Markets
- The Visual Investor
- VectorVest, Inc.
- Executive Premier Workshop
- One-Day Options Course
- OptionsPro
- Retirement Income Workshop
- Sure-Fire Trading Systems (VectorVest, Inc.)
- Trading as a Business Workshop
- VectorVest 7 EOD
- VectorVest 7 RealTime/IntraDay
- VectorVest AutoTester
- VectorVest Educational Services
- VectorVest OnLine
- VectorVest Options Analyzer
- VectorVest ProGraphics v6.0
- VectorVest ProTrader 7
- VectorVest RealTime Derby Tool
- VectorVest Simulator
- VectorVest Variator
- VectorVest Watchdog
