HOT TOPICS LIST
- MACD
- Fibonacci
- RSI
- Gann
- ADXR
- Stochastics
- Volume
- Triangles
- Futures
- Cycles
- Volatility
- ZIGZAG
- MESA
- Retracement
- Aroon
INDICATORS LIST
LIST OF TOPICS
PRINT THIS ARTICLE
by Andrew Hetherington
The chart for Sandisk Corporation [SNDK] shows two distinct triangle patterns in the last year.
Position: N/A
Andrew Hetherington
Classic Dow Theorist who trades as a pure technician, using pattern recognition.
PRINT THIS ARTICLE
TRIANGLES
Triangle Patterns and Direction Changes
03/28/02 09:31:52 AMby Andrew Hetherington
The chart for Sandisk Corporation [SNDK] shows two distinct triangle patterns in the last year.
Position: N/A
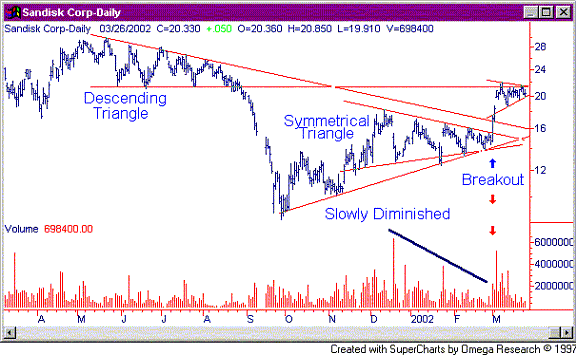
| In Figure 1 below we have Sandisk Corporation (SNDK) with two very distinctive patterns. |
| We have a four-month descending triangle with very nice volume on the creation of the pattern formed between May and August of 2001. This triangle broke on the downside at the end of August from the $23.00 area to $8.61 when it bottomed out on September 27, 2002. |

|
| Figure 1: Daily chart for the last year for SNDK. |
| Graphic provided by: SuperCharts. |
| |
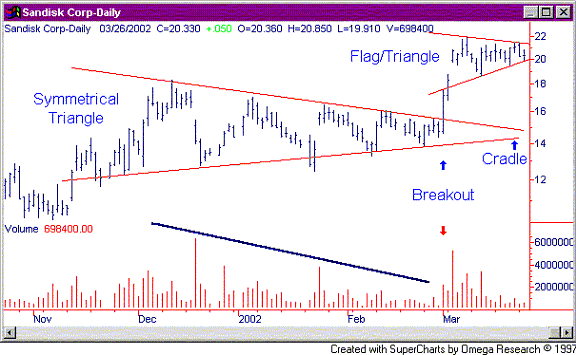
| Shortly after bottoming out it began a four-month symmetrical triangle. This type of pattern can be bearish or bullish so you must await confirmation to be sure which direction it will head. This triangle has near-perfect volume with a very strong breakout. It has now consolidated with a flag/triangle and is deciding if it wants to throw back a little further before resuming its inevitable up move. If over the next two to three days we see prices lower than $20.00 then an excellent accumulation area is in the $15.00 - $17.00 area to go long. If it goes straight up above this small consolidation area I wouldn't chase it up since I would only be comfortable with a buy point lower than the current price. My objective is to limit downside risk so I try and play as close to the lines as possible. I normally trade within patterns but if I await a breakout then I like to go long or short in the cradle of a triangle as I've labeled below in Figure 2. |
 Figure 2: Daily chart for the last six months for SNDK. Knowing that this is a bottom reversal triangle as opposed to a consolidation triangle, it is my assertion that accumulating in the cradle would be a very wise investment decision and that this equity will go much higher in the next six -12 months. |
Classic Dow Theorist who trades as a pure technician, using pattern recognition.
| Toronto, Canada |
Click here for more information about our publications!
Comments
Date: 04/02/02Rank: 4Comment:

Request Information From Our Sponsors
- StockCharts.com, Inc.
- Candle Patterns
- Candlestick Charting Explained
- Intermarket Technical Analysis
- John Murphy on Chart Analysis
- John Murphy's Chart Pattern Recognition
- John Murphy's Market Message
- MurphyExplainsMarketAnalysis-Intermarket Analysis
- MurphyExplainsMarketAnalysis-Visual Analysis
- StockCharts.com
- Technical Analysis of the Financial Markets
- The Visual Investor
- VectorVest, Inc.
- Executive Premier Workshop
- One-Day Options Course
- OptionsPro
- Retirement Income Workshop
- Sure-Fire Trading Systems (VectorVest, Inc.)
- Trading as a Business Workshop
- VectorVest 7 EOD
- VectorVest 7 RealTime/IntraDay
- VectorVest AutoTester
- VectorVest Educational Services
- VectorVest OnLine
- VectorVest Options Analyzer
- VectorVest ProGraphics v6.0
- VectorVest ProTrader 7
- VectorVest RealTime Derby Tool
- VectorVest Simulator
- VectorVest Variator
- VectorVest Watchdog
