HOT TOPICS LIST
- MACD
- Fibonacci
- RSI
- Gann
- ADXR
- Stochastics
- Volume
- Triangles
- Futures
- Cycles
- Volatility
- ZIGZAG
- MESA
- Retracement
- Aroon
INDICATORS LIST
LIST OF TOPICS
PRINT THIS ARTICLE
by Chaitali Mohile
The pullback rally of the Australia iShares has hit its previous high resistance. The index is likely to challenge the support line in the near term.
Position: N/A
Chaitali Mohile
Active trader in the Indian stock markets since 2003 and a full-time writer. Trading is largely based upon technical analysis.
PRINT THIS ARTICLE
CHART ANALYSIS
Australia iShares Reacting Near Resistance
07/08/11 01:32:54 PMby Chaitali Mohile
The pullback rally of the Australia iShares has hit its previous high resistance. The index is likely to challenge the support line in the near term.
Position: N/A
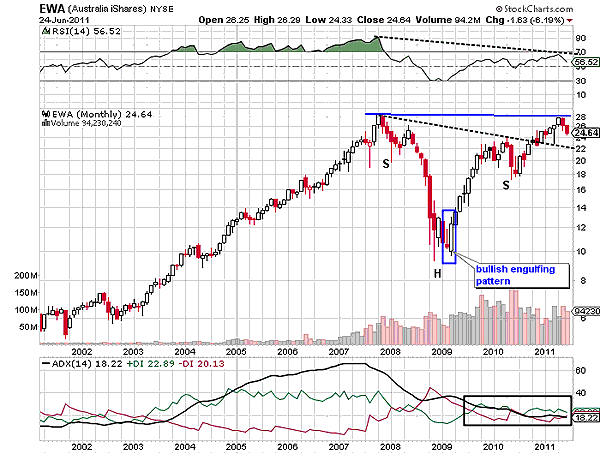
| The Australia iShares (EWA) made an all-time high at 28 levels in late 2007. The relative strength index (RSI) (14) was overbought for more than two years, indicating an upcoming bearish rally. The average directional index (ADX) (14) in Figure 1 was extremely overheated at 60 levels. This was another reversal indication for EWA. As a result, the prior bullish rally plunged from 28 levels. Initially, the rally tried to regain the previous high level but failed. Thereafter, the index underwent a nosedive to 10, losing almost 18 points from the high. The declining RSI (14) established support at 30 levels, and the uptrend has completely reversed, forming a fresh downtrend for EWA. However, the newly developed bearish trend immediately turned overheated, preventing additional loss to the bearish rally. Eventually, the rally stabilized at the new low (10 levels), forming a bullish engulfing candlestick pattern in Figure 1. On these notes, a fresh relief rally was born in early 2009. |
| The oscillator also began to surge in a bullish area above 50 levels. Due to the diminishing selling pressure, an overheated downtrend reflected by the ADX (14) turned weaker. However, an uptrend could not develop strongly as well. The buying pressure indicated by the positive directional index (+DI) remained marginally higher than the selling pressure (negative directional index -DI). The pullback rally drifted a few points from 22 levels, forming a right shoulder. The dotted line in Figure 1 shows a declining neckline of an inverted head & shoulders -- a bullish trend reversal pattern. A bullish breakout of this pattern begins a fresh robust bullish rally, and therefore, the pattern is considered as a major formation, especially the one that occurs on the monthly time frame. |

|
| FIGURE 1: EWA, MONTHLY |
| Graphic provided by: StockCharts.com. |
| |
| EWA converted the declining neckline resistance to the support, initiating a fresh bullish rally. The index soon reached the historical resistance at 28 levels. Although the rally hit the previous high, the RSI (14) made a lower high. The ADX (14) lacked the bullish pressure to strengthen the developing uptrend. A negative divergence of the oscillator attracted the bears waiting on the sidelines to grab the opportunity. Therefore, EWA retraced from 28 levels and is likely to retrace toward the neckline support. |
| According to the monthly time frame in Figure 1, EWA has been plunging for past two months. The trend is weak, and the RSI (14) is not showing any signs of recovery. Hence, the existing bearish force would pull down the index, hitting the neckline support at 22 levels. The rally has to establish support at the dotted line to prevent further serious damage to the index. In the long run EWA is likely remain range-bound between the neckline support and the previous high resistance. Since the range is very narrow, trading would be very tricky for long-term investors. |
Active trader in the Indian stock markets since 2003 and a full-time writer. Trading is largely based upon technical analysis.
| Company: | Independent |
| Address: | C1/3 Parth Indraprasth Towers. Vastrapur |
| Ahmedabad, Guj 380015 | |
| E-mail address: | chaitalimohile@yahoo.co.in |
Traders' Resource Links | |
| Independent has not added any product or service information to TRADERS' RESOURCE. | |
Click here for more information about our publications!
PRINT THIS ARTICLE

Request Information From Our Sponsors
- StockCharts.com, Inc.
- Candle Patterns
- Candlestick Charting Explained
- Intermarket Technical Analysis
- John Murphy on Chart Analysis
- John Murphy's Chart Pattern Recognition
- John Murphy's Market Message
- MurphyExplainsMarketAnalysis-Intermarket Analysis
- MurphyExplainsMarketAnalysis-Visual Analysis
- StockCharts.com
- Technical Analysis of the Financial Markets
- The Visual Investor
- VectorVest, Inc.
- Executive Premier Workshop
- One-Day Options Course
- OptionsPro
- Retirement Income Workshop
- Sure-Fire Trading Systems (VectorVest, Inc.)
- Trading as a Business Workshop
- VectorVest 7 EOD
- VectorVest 7 RealTime/IntraDay
- VectorVest AutoTester
- VectorVest Educational Services
- VectorVest OnLine
- VectorVest Options Analyzer
- VectorVest ProGraphics v6.0
- VectorVest ProTrader 7
- VectorVest RealTime Derby Tool
- VectorVest Simulator
- VectorVest Variator
- VectorVest Watchdog
