HOT TOPICS LIST
- MACD
- Fibonacci
- RSI
- Gann
- ADXR
- Stochastics
- Volume
- Triangles
- Futures
- Cycles
- Volatility
- ZIGZAG
- MESA
- Retracement
- Aroon
INDICATORS LIST
LIST OF TOPICS
PRINT THIS ARTICLE
by Donald W. Pendergast, Jr.
A daily based system buy signal is nice, but when it occurs in union with a bullish weekly chart breakout setup, serious traders will want to take note.
Position: N/A
Donald W. Pendergast, Jr.
Donald W. Pendergast is a financial markets consultant who offers specialized services to stock brokers and high net worth individuals who seek a better bottom line for their portfolios.
PRINT THIS ARTICLE
CHART ANALYSIS
Gamestop Has A Daily Buy Signal Amid Bullish Weekly Backdrop
06/23/11 10:21:31 AMby Donald W. Pendergast, Jr.
A daily based system buy signal is nice, but when it occurs in union with a bullish weekly chart breakout setup, serious traders will want to take note.
Position: N/A
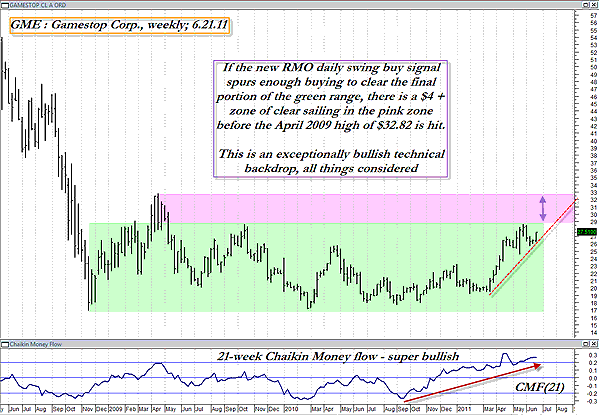
| Shares of Gamestop (GME) have been mired in a gigantic two-and-a-half year bottoming and/or consolidation pattern (based on weekly chart analysis), and with the stock now in ascending mode -- and possibly ready to finally break out of one of the last remaining resistance areas -- the appearance of a recent Rahul Mohindar oscillator (RMO) daily swing buy signal seems to imply that the stock may be finally ready to launch higher. Here's a closer look now. |

|
| FIGURE 1: GME, WEEKLY. Breakouts from large, multiyear patterns can offer traders some very unique opportunities. |
| Graphic provided by: MetaStock. |
| |
| While the daily RMO swing buy signal is important to note, I want to focus on GME's weekly chart, because of its super-bullish implications. First off, note in Figure 1 just how close the stock is to being able to finally break free of the upper resistance barrier near $28.66 (the border between the green and pink shaded areas); a clean break above that price with a confirmed weekly close also above it will mean that the stock has a virtually unhindered pathway to challenge the April 2009 high of $32.82. This fact could help give traders some extra confidence if they choose to go long at this juncture; trend-followers might want to initiate a fresh long position, relying on a 2 * average true range (ATR) 10 volatility-based trailing/initial stop to manage the position till final closeout. Less-aggressive traders who aren't as convinced that a sustained market rally is likely might want to run a simple three-bar trailing stop of the daily lows. Truly antsy traders might also want to use that previously mentioned resistance area at $28.66 to take partial profits (should they materialize), using either of the trailing-stop styles just mentioned. |
| Trend-followers generally benefit from a positive money flow profile in the stocks and futures contracts they trade, and in the case of GME, the 21-week Chaikin money flow (CMF)(21) indicator (bottom of chart) is in the extremely bullish category, offering an extra measure of technical confidence for GME bulls. |
| When analyzing your list of daily buy signals from your favorite system, always take a look at the price dynamics (especially key support/resistance levels) of the weekly chart as well. You may be surprised at what you discover. |
Donald W. Pendergast is a financial markets consultant who offers specialized services to stock brokers and high net worth individuals who seek a better bottom line for their portfolios.
| Title: | Writer, market consultant |
| Company: | Linear Trading Systems LLC |
| Jacksonville, FL 32217 | |
| Phone # for sales: | 904-239-9564 |
| E-mail address: | lineartradingsys@gmail.com |
Traders' Resource Links | |
| Linear Trading Systems LLC has not added any product or service information to TRADERS' RESOURCE. | |
Click here for more information about our publications!
PRINT THIS ARTICLE

Request Information From Our Sponsors
- StockCharts.com, Inc.
- Candle Patterns
- Candlestick Charting Explained
- Intermarket Technical Analysis
- John Murphy on Chart Analysis
- John Murphy's Chart Pattern Recognition
- John Murphy's Market Message
- MurphyExplainsMarketAnalysis-Intermarket Analysis
- MurphyExplainsMarketAnalysis-Visual Analysis
- StockCharts.com
- Technical Analysis of the Financial Markets
- The Visual Investor
- VectorVest, Inc.
- Executive Premier Workshop
- One-Day Options Course
- OptionsPro
- Retirement Income Workshop
- Sure-Fire Trading Systems (VectorVest, Inc.)
- Trading as a Business Workshop
- VectorVest 7 EOD
- VectorVest 7 RealTime/IntraDay
- VectorVest AutoTester
- VectorVest Educational Services
- VectorVest OnLine
- VectorVest Options Analyzer
- VectorVest ProGraphics v6.0
- VectorVest ProTrader 7
- VectorVest RealTime Derby Tool
- VectorVest Simulator
- VectorVest Variator
- VectorVest Watchdog
