HOT TOPICS LIST
- MACD
- Fibonacci
- RSI
- Gann
- ADXR
- Stochastics
- Volume
- Triangles
- Futures
- Cycles
- Volatility
- ZIGZAG
- MESA
- Retracement
- Aroon
INDICATORS LIST
LIST OF TOPICS
PRINT THIS ARTICLE
by Koos van der Merwe
Here's a look at Apple Inc. the way WD Gann would have seen it.
Position: Sell
Koos van der Merwe
Has been a technical analyst since 1969, and has worked as a futures and options trader with First Financial Futures in Johannesburg, South Africa.
PRINT THIS ARTICLE
GANN
WD Gann's Apple
06/21/11 11:37:08 AMby Koos van der Merwe
Here's a look at Apple Inc. the way WD Gann would have seen it.
Position: Sell
| The market does seem to be recovering after the six week selloff, but why are Apple (AAPL) shares continuing to fall? Are short-sellers going overboard? Rumor has it that the iPad 3 will be out in September, offering even better screen resolution, not to mention 3-D capability, so why the negativity? |

|
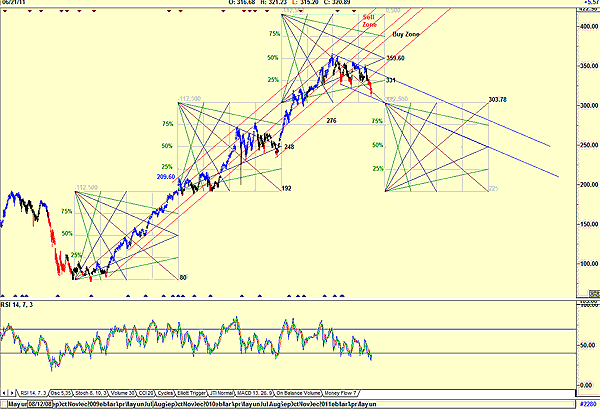
| FIGURE 1: APPLE WITH GANN SQUARES |
| Graphic provided by: AdvancedGET. |
| |
| Figure 1 is a Gann chart and shows the following: a. The first Gann square squared out at the $192 level, with the share price rising to $209.60 using the $192 level as a base before its next up move. b. In the second Gann square, which squared out at the $303.78 level, the price rose to the $276 level, the 75% level before consolidating around the 50% level at $248. c. The share price then rose into the third Gann square, topping out at $359.60, the 50% level, consolidating at $331, the 25% level. d. This means that according to Gann, the price should move into the fourth square shown on the chart and test the $303.78 level, even possibly forming a base at the $276 level. With Apple's product strength, we could ask, "Why should this weakness happen?" I will not even try to answer that question. Note that the share price has fallen below its 1x1 buy zone. I will now start looking for a new buy zone, hopefully from the $303.78 level. The relative strength index (RSI) is oversold and could suggest a buy soon, although any serious bad news could see the RSI meandering at this level as the share price forms a new base. WD Gann would have sold AAPL shares at the $359 level, the sell zone as shown on the chart. He would not be a buyer at the moment but would watch the chart carefully as the share price moves into the fourth square, looking for a consolidation pattern to develop. |
Has been a technical analyst since 1969, and has worked as a futures and options trader with First Financial Futures in Johannesburg, South Africa.
| Address: | 3256 West 24th Ave |
| Vancouver, BC | |
| Phone # for sales: | 6042634214 |
| E-mail address: | petroosp@gmail.com |
Click here for more information about our publications!
Comments

Request Information From Our Sponsors
- VectorVest, Inc.
- Executive Premier Workshop
- One-Day Options Course
- OptionsPro
- Retirement Income Workshop
- Sure-Fire Trading Systems (VectorVest, Inc.)
- Trading as a Business Workshop
- VectorVest 7 EOD
- VectorVest 7 RealTime/IntraDay
- VectorVest AutoTester
- VectorVest Educational Services
- VectorVest OnLine
- VectorVest Options Analyzer
- VectorVest ProGraphics v6.0
- VectorVest ProTrader 7
- VectorVest RealTime Derby Tool
- VectorVest Simulator
- VectorVest Variator
- VectorVest Watchdog
- StockCharts.com, Inc.
- Candle Patterns
- Candlestick Charting Explained
- Intermarket Technical Analysis
- John Murphy on Chart Analysis
- John Murphy's Chart Pattern Recognition
- John Murphy's Market Message
- MurphyExplainsMarketAnalysis-Intermarket Analysis
- MurphyExplainsMarketAnalysis-Visual Analysis
- StockCharts.com
- Technical Analysis of the Financial Markets
- The Visual Investor
