HOT TOPICS LIST
- MACD
- Fibonacci
- RSI
- Gann
- ADXR
- Stochastics
- Volume
- Triangles
- Futures
- Cycles
- Volatility
- ZIGZAG
- MESA
- Retracement
- Aroon
INDICATORS LIST
LIST OF TOPICS
PRINT THIS ARTICLE
by Dennis D. Peterson
A statistical approach for finding persistent cycles also works to find trends.
Position: N/A
Dennis D. Peterson
Market index trading on a daily basis.
PRINT THIS ARTICLE
RATE CHANGE - PRICE
Random Walk Index
04/02/02 02:50:40 PMby Dennis D. Peterson
A statistical approach for finding persistent cycles also works to find trends.
Position: N/A
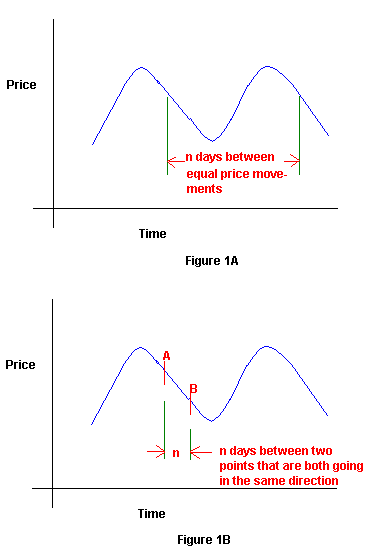
| When you see a trend your first instinct might be to apply a moving average to trade the trend. You could get a bit more sophisticated and use MACD (moving average convergence/divergence), but MACD still uses moving averages. The fundamental problem is that moving averages are trend following devices - they don't tell you whether or not you are in a trend. Examples of trend detection indicators are VHF and R-squared. R-squared is excellent and I occasionally use it in conjunction with a linear regression slope to get a quick read on price movement. What's unique about R-squared is that it uses a statistical approach. Random walk index (RWI) also takes a statistical approach, but while R-squared compares how prices are changing relative to a horizontal linear regression line, RWI asks if the current price change is statistically the same as a past price change. Let's take a couple of examples to understand the theory. Suppose that price is moving up and down in repetitive fashion as shown by Figure 1A. If price were in a perfect sinusoidal pattern then you could find a value of n, where n is the number of trading periods to look back for a past price movement that is the same as today's price movement. If you ask how price movement today compares to price movement n days ago, and you have chosen n to be the period of a repetitive cycle, then the correlation is going to be high-- E. Micheal Poulos addressed this question in the article, "Are There Persistent Cycles?" in Stocks and Commodities, September 1992. |
| Poulos found, after examining five different commodities contracts as well as the S&P 500, Digital Equipment, T-bonds and Teledyne, that autocorrelation gets as high as 0.15. Autocorrelation is a statistical measure that assigns a value to the degree of correlation. A value of 1.0 is a perfect correlation. So 0.15 is hardly a staggering correlation. But like so much market data, the pursuit of cycles for the sake of finding one that is repetitive is akin to looking for something that isn't there. On the other hand I would argue the market is not random in its action. If you believe in the efficient market hypothesis then you will argue for randomness. It is true that if the market had an up day today, the probability that tomorrow will be up is always close to 50%. Nor does the market favor either successive up or down days in a row. Nevertheless the market does tend to trend at times-- commodities better than equities. |

|
| Figure 1: Idealized Price for Finding Persistent Cycles. Figure 1A attempts to find future price movement based on a repeating cycle, while Figure 1B attempts to find future price based on trend persistence. |
| Graphic provided by: MetaStock. |
| Graphic provided by: Data vendor: eSignal. |
| |
| Now back to Figure 1B. If you compared price movement at point B with price movement at point A, and price was trending, then you should find a high correlation. In Figure 1B, A and B are part of a downtrend. But now the key is to use percentage change. You can't compare price directly but you should be able to compare percentage price change. Poulus looks at: High-low(n days ago)/Avg Range *(square root of n) and High(n days ago)-low/Avg Range*(square root of n). It may not occur to you until you start system testing a trading system built around these formulas that by dividing a range (high-low) by average range, you are comparing price range change between points A and B (Figure 1B). If price is changing the same at point A and B, and the period is relatively short, you are likely in a trend. What Poulus did was to observe that the "ratio of today's price range to the range of prices over the last n days should be the square root of n." He then uses the above formulas as a measure of correlation. If the first or second formula is greater than one then you are likely in a trend. Now it is up to you to find a value of n that will work as a trading system. |
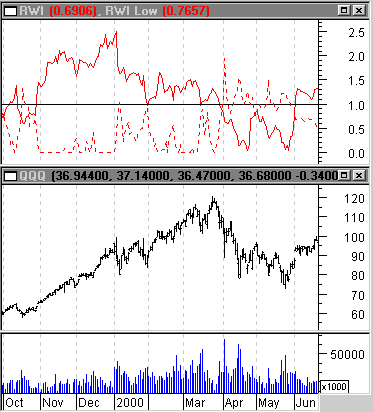
I observed that the first of Poulos's formulas, which should give a measure of uptrend, did in fact get above 1.0 when QQQ was in a strong uptrend, and the second of Poulo's formulas, a measure of downtrend, went to zero (Figure 2). As I scanned the entire history I could see it wasn't always necessary to have RWI > 1.0 and sometimes I wanted the high and low versions of RWI (RWIH and RWIL respectively) to have some separation, because a sideways move of the market could bring about two nearly equal values of RWI, and for generating trend trading signals I wanted either RWIH or RWIL to dominate. Figure 2: Daily QQQ Price and Volume (bottom chart) and RWI (top chart). RWI has two components: a measure of today's high with previous lows (uptrend and seen as a solid red line in top chart) and a measure of today's low with previous highs (downtrend and seen as a dashed red line). In a strong uptrend the solid red line moves above 1.0, while the downtrend dashed red line goes to zero. In a strong downtrend the dashed line moves above 1.0, while the solid line goes to zero. |
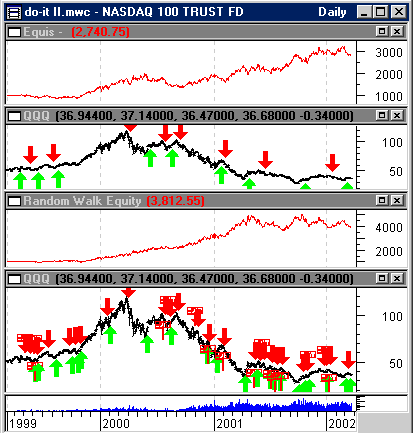
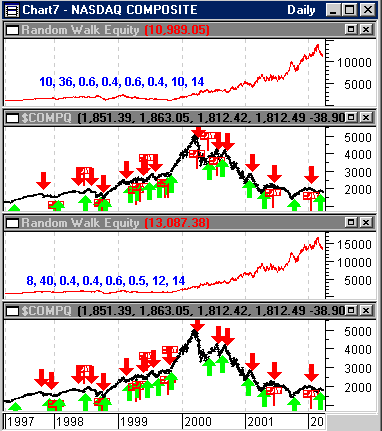
I now built a trading system and optimized everything. Hopefully I would find that equity performance was intolerant of some of the variables so optimization wouldn't just be a curve fit. When I first saw what RWIH and RWIL did from 1999 through April 2001, I was impressed. I looked at the long (Figure 3: green up arrows) and short (Figure 3: red down arrows) entries and exits (Figure 3: red exit signs) and I liked what had happened. Now I looked at the values that were chosen for RWIH and RWIL. When you use RWIH and RWIL you input two values for each. The first number is the minimum number of periods and the second is the maximum (RWIH (min, max), RWIL (min, max)). The system optimized on 2 and 38. What did that mean? Figure 3: QQQ Daily Price and Volume with Equity Performance. The bottom pair of charts are the results of optimizing RWIH and RWIL in a trading system and the top pair the results of optimizing the periods for a moving average crossover trading system. Both trading systems started with $1,000 equity. The optimized RWIH and RWIL did better than the optimized moving average crossover, except for the period from April 2001 to the present. The implementation by Metastock means that the maximum value of the index found by looking at periods from two days, up to 38 days back, is the value returned for today. This means that very short trends, as well as ones going back 38 days, generate today's index. I was hoping I wouldn't see that kind of spread. Also bothersome was that I had more losing trades than winning ones. Analyzing the trades in more detail showed the profit derived from optimization came from staying in a position, long or short, for several bars. Money was not made when price was going sideways. Clearly equity performance took a turn for the worse after 4/17/2001. Why? I then tested from 4/17/2001 to the present, and found that the system liked 10 and 48 for the minimum and maximum inputs to RWIH and RWIL, as compared to two and 38 for an optimization from 1999 and on. Trading from 4/17/2001 to the present, using 10 and 48 for RWI minimum and maximum, made 126.54% annually, as compared to -15.89% for buy and hold. Only three trades were made, and all three were correct, as compared to 16+ trades for the same time period (4/17/2001 and on) as a result of optimizing from 1999 and on. It was as if there were two different markets. I went back to the Poulus article and an observation at the end of his article now made a lot more sense. Poulus decided to see how many days you had to look back for the largest RWI. What he found was a distinct break in the number of days, "Thus the markets, to a very good approximation, can be thought of as displaying two distinct personalities! The ... dividing line between short and long term behavior lies between seven and eight days." If you optimize on the Nasdaq composite you can go back many years and I went back to 1994. It showed that for the gradual uptrend of the Nasdaq composite preceding the strong move up in 1999 using RWI with two and 38 made little money. The market has a long-term and short-term behavior, and that behavior influences how well you can trade range (high-low). Is there a market indicator that tells you which hat the market is currently wearing? That is, is the market in its long term or short term behavior? I tried McClellan with no success as well as a number of combinations of ROC (rate of change), using price, triangle price and ATR with no clear answer. So I went back to new highs and lows ratio. My intent was to filter entry, long and short, and let the exit still occur as before. There seems to be some robustness in this approach as the worst loss was zero when applied to QQQ for all combinations of the optimized variables. That is, I watch the worst gain and loss as the combinations are tried. When I see a lot of negative losses I am suspicious the approach is not robust. As I watched this system, all of the numbers were positive except for some cases that got down to zero. But this is not a silver bullet as there are brief periods when equity goes down and you need to let the system make up the loss. The final charts are for the Nasdaq so you can see what equity performance looked like before 1999 and after 2000. Shown are two sets of values for the optimization variables opt1 through opt8. The bottom two charts are the best equity performance and the top two charts the third best.  Figure 4: Daily Nasdaq Composite With Equity Performance. Top two chart use the third best performance of the optimization variables opt1 through opt8 and are shown in blue. The bottom two charts the best performance. When you compare the trade action between these charts and those in Figure 3, it is clear that using new highs and lows ratios reduced long and short entries, which is the intent of using them. The trading system I used for Metastock is below. But I don't think it's as important as the observation about market behavior. I know this market has been tough to trade-- others have told me and I know personally. What I would suggest is most important is that the market relative to range behavior, high-low, has two sides: short term and long term. Long entry: nh:=Security("c:\test\x.nasd-h",C); nl:=Security("c:\test\x.nasd-l",C); periodsf:=opt8; periodss:=opt9; Mov(nh/(nh+nl),opt8,S)>Mov(nh/(nh+nl),opt9,S) AND RWIH(opt1,opt2)>opt5 AND RWIH(opt1,opt2)>RWIL(opt1,opt2)+opt3 Long exit: RWIH(opt1,opt2) < opt5 Short entry: nh:=Security("c:\test\x.nasd-h",C); nl:=Security("c:\test\x.nasd-l",C); periodsf:=opt8; periodss:=opt9; Mov(nh/(nh+nl),opt8,S) < Mov(nh/(nh+nl),opt9,S) AND RWIL(opt1,opt2)>opt6 AND RWIL(opt1,opt2)>RWIH(opt1,opt2)+opt4 Short exit: RWIL(opt1,opt2) < opt6 |
Market index trading on a daily basis.
| Title: | Staff Writer |
| Company: | Technical Analysis, Inc. |
| Address: | 4757 California Ave SW |
| Seattle, WA 98116-4499 | |
| Phone # for sales: | 206 938 0570 |
| Fax: | 206 938 1307 |
| Website: | www.traders.com |
| E-mail address: | dpeterson@traders.com |
Traders' Resource Links | |
| Charting the Stock Market: The Wyckoff Method -- Books | |
| Working-Money.com -- Online Trading Services | |
| Traders.com Advantage -- Online Trading Services | |
| Technical Analysis of Stocks & Commodities -- Publications and Newsletters | |
| Working Money, at Working-Money.com -- Publications and Newsletters | |
| Traders.com Advantage -- Publications and Newsletters | |
| Professional Traders Starter Kit -- Software | |
Click here for more information about our publications!
Comments
Date: 04/14/02Rank: 4Comment:

Request Information From Our Sponsors
- VectorVest, Inc.
- Executive Premier Workshop
- One-Day Options Course
- OptionsPro
- Retirement Income Workshop
- Sure-Fire Trading Systems (VectorVest, Inc.)
- Trading as a Business Workshop
- VectorVest 7 EOD
- VectorVest 7 RealTime/IntraDay
- VectorVest AutoTester
- VectorVest Educational Services
- VectorVest OnLine
- VectorVest Options Analyzer
- VectorVest ProGraphics v6.0
- VectorVest ProTrader 7
- VectorVest RealTime Derby Tool
- VectorVest Simulator
- VectorVest Variator
- VectorVest Watchdog
- StockCharts.com, Inc.
- Candle Patterns
- Candlestick Charting Explained
- Intermarket Technical Analysis
- John Murphy on Chart Analysis
- John Murphy's Chart Pattern Recognition
- John Murphy's Market Message
- MurphyExplainsMarketAnalysis-Intermarket Analysis
- MurphyExplainsMarketAnalysis-Visual Analysis
- StockCharts.com
- Technical Analysis of the Financial Markets
- The Visual Investor
