HOT TOPICS LIST
- MACD
- Fibonacci
- RSI
- Gann
- ADXR
- Stochastics
- Volume
- Triangles
- Futures
- Cycles
- Volatility
- ZIGZAG
- MESA
- Retracement
- Aroon
INDICATORS LIST
LIST OF TOPICS
PRINT THIS ARTICLE
by Mike Carr, CMT
The Dow Jones Industrial Average is near 12,000, a price level that has proven to be of unusual importance in the past.
Position: Sell
Mike Carr, CMT
Mike Carr, CMT, is a member of the Market Technicians Association, and editor of the MTA's newsletter, Technically Speaking. He is also the author of "Smarter Investing in Any Economy: The Definitive Guide to Relative Strength Investing," and "Conquering the Divide: How to Use Economic Indicators to Catch Stock Market Trends."
PRINT THIS ARTICLE
CHART ANALYSIS
DJIA At Critical Support Level
06/21/11 07:55:24 AMby Mike Carr, CMT
The Dow Jones Industrial Average is near 12,000, a price level that has proven to be of unusual importance in the past.
Position: Sell
| Trading is often done on very short time frames, but looking at long-term history can offer valuable insights. This is especially true at a time like this, when the market has gone almost nowhere in the past 10 years but provided traders with a virtual roller-coaster ride to get there. |
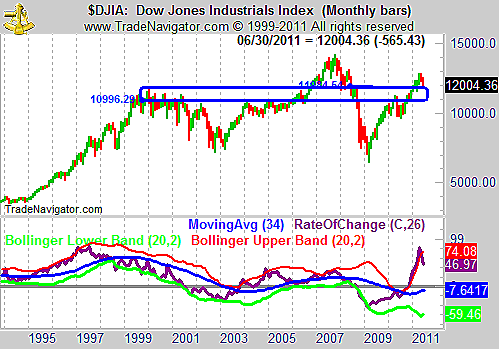
| A monthly chart of the Dow Jones Industrial Average (DJIA) (Figure 1) shows that the average spends little time between 11,000 and 12,000. That proved to be the upper limit of the bull market that ended with the crash of Internet stocks about a decade ago. The lower limit of that range served as resistance through the initial move off the 2002 bottom. A brief move above 12,000 in 2007 ended with the deepest bear market since the Great Depression. Earlier this year, the market again rose above 12,000. |

|
| FIGURE 1: DJIA, MONTHLY. The 1,000-point range between 11,000 and 12,000 tends to be passed through quickly by the DJIA. |
| Graphic provided by: Trade Navigator. |
| |
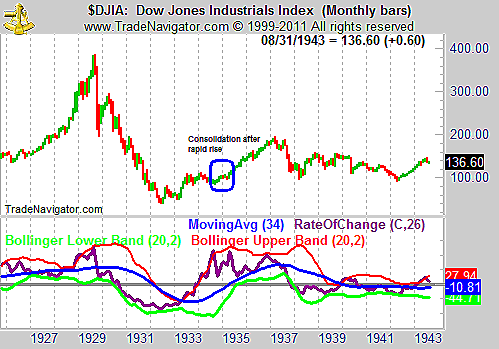
| Now nearly 8% below its 52-week high, the DJIA is close to 12,000. The rate of change shows how quickly the market moved higher off the 2009 bottom. A similar overbought pattern in that indicator appeared in the mid-1930s (Figure 2). |

|
| FIGURE 2: DJIA, MONTHLY. Consolidation occurred in the DJIA after the ROC broke downward through its upper Bollinger Band in 1934. |
| Graphic provided by: Trade Navigator. |
| |
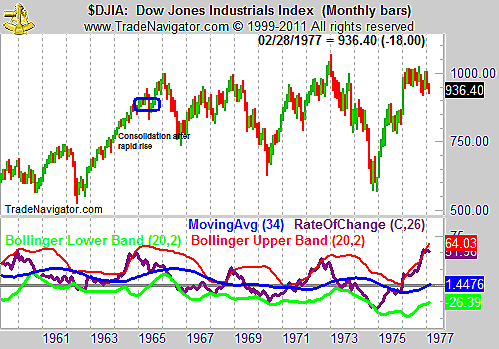
| A similar pattern in the rate of change (ROC) was seen in the mid-1960s on the monthly chart (Figure 3). A brief consolidation followed when the indicator broke back down through its upper band. |

|
| FIGURE 3: DJIA, MONTHLY. The ROC was also extremely overbought in 1965. |
| Graphic provided by: Trade Navigator. |
| |
| With history as a guide, it seems unlikely the DJIA can move sharply higher from its current level. It also seems unlikely we will see a consolidation pattern hold above 11,000 for an extended period of time. A break below 12,000 would indicate a higher probability that the next 1,000 points on the DJIA would be down. |
Mike Carr, CMT, is a member of the Market Technicians Association, and editor of the MTA's newsletter, Technically Speaking. He is also the author of "Smarter Investing in Any Economy: The Definitive Guide to Relative Strength Investing," and "Conquering the Divide: How to Use Economic Indicators to Catch Stock Market Trends."
| Website: | www.moneynews.com/blogs/MichaelCarr/id-73 |
| E-mail address: | marketstrategist@gmail.com |
Click here for more information about our publications!
Comments
Date: 07/04/11Rank: 4Comment: Hello Mr. Mark Carr I certainly enjoy reading your article on Traders.com ! Notice how today s jump http://finance.yahoo.com/q/bc?s=^IXIC t=3m l=on z=l q=l c= in prices for leading stocks ended the day well above the recent trading ranges and strongly putting the Nasdaq index toward a New Bullish Trend
I DON T Believe This will last Do you ? But will this developing bottom stay put ? Will this bullish trend do much more than reach the 50-day moving averages ? Wel Now we know it did on LOW Volume ? Will the end of June 11 ( QE2) and likely Terrible Q2 earnings reports Dampen any revived buying interest here at the end of the month and quarter and QE2 ? The bulls should do nothing more than breathe a sigh of relief . . . that supports have held.
There is a lot of work to do ( Dreaming too !) if the Bullish Trend is going to be repaired. I don t see it. I think we will CRASH BURN SOON maybe by 7/14/11 or so....??? Maybe the next few weeks will be some relief from the strong selling the last few months, there is nothing to suggest that it will be lasting. RIGHT ! Nice (LOW VOLUME ?) rally Last Fri - but just a relief from selling while a lot of traders go on vacation for a couple of weeks and this window dressing period works to an end. I d (would Should) Be careful to Not get lured into taking too much of the bait, here. I d like to SHORT the Emini S P 500 or NASDAQ ! BUT, It might be a bit too Early Right ? Good Trading to You Thanks Again ! TakeCare,Dave
Date: 07/04/11Rank: 5Comment: Hello Mr. Mark Carr I certainly enjoy reading your article on Traders.com ! Notice how today s jump http://finance.yahoo.com/q/bc?s=^IXIC t=3m l=on z=l q=l c= in prices for leading stocks ended the day well above the recent trading ranges and strongly putting the Nasdaq index toward a New Bullish Trend
I DON T Believe This will last Do you ? But will this developing bottom stay put ? Will this bullish trend do much more than reach the 50-day moving averages ? Wel Now we know it did on LOW Volume ? Will the end of June 11 ( QE2) and likely Terrible Q2 earnings reports Dampen any revived buying interest here at the end of the month and quarter and QE2 ? The bulls should do nothing more than breathe a sigh of relief . . . that supports have held.
There is a lot of work to do ( Dreaming too !) if the Bullish Trend is going to be repaired. I don t see it. I think we will CRASH BURN SOON maybe by 7/14/11 or so....??? Maybe the next few weeks will be some relief from the strong selling the last few months, there is nothing to suggest that it will be lasting. RIGHT ! Nice (LOW VOLUME ?) rally Last Fri - but just a relief from selling while a lot of traders go on vacation for a couple of weeks and this window dressing period works to an end. I d (would Should) Be careful to Not get lured into taking too much of the bait, here. I d like to SHORT the Emini S P 500 or NASDAQ ! BUT, It might be a bit too Early Right ? Good Trading to You Thanks Again ! TakeCare,Dave

|

Request Information From Our Sponsors
- StockCharts.com, Inc.
- Candle Patterns
- Candlestick Charting Explained
- Intermarket Technical Analysis
- John Murphy on Chart Analysis
- John Murphy's Chart Pattern Recognition
- John Murphy's Market Message
- MurphyExplainsMarketAnalysis-Intermarket Analysis
- MurphyExplainsMarketAnalysis-Visual Analysis
- StockCharts.com
- Technical Analysis of the Financial Markets
- The Visual Investor
- VectorVest, Inc.
- Executive Premier Workshop
- One-Day Options Course
- OptionsPro
- Retirement Income Workshop
- Sure-Fire Trading Systems (VectorVest, Inc.)
- Trading as a Business Workshop
- VectorVest 7 EOD
- VectorVest 7 RealTime/IntraDay
- VectorVest AutoTester
- VectorVest Educational Services
- VectorVest OnLine
- VectorVest Options Analyzer
- VectorVest ProGraphics v6.0
- VectorVest ProTrader 7
- VectorVest RealTime Derby Tool
- VectorVest Simulator
- VectorVest Variator
- VectorVest Watchdog
