HOT TOPICS LIST
- MACD
- Fibonacci
- RSI
- Gann
- ADXR
- Stochastics
- Volume
- Triangles
- Futures
- Cycles
- Volatility
- ZIGZAG
- MESA
- Retracement
- Aroon
INDICATORS LIST
LIST OF TOPICS
PRINT THIS ARTICLE
by Chaitali Mohile
The bearish Bank of America stock is struggling to stabilize. Will the consolidation lead to a bullish breakout?
Position: N/A
Chaitali Mohile
Active trader in the Indian stock markets since 2003 and a full-time writer. Trading is largely based upon technical analysis.
PRINT THIS ARTICLE
TECHNICAL ANALYSIS
BAC Shifting To Bullish Track?
06/20/11 03:25:23 PMby Chaitali Mohile
The bearish Bank of America stock is struggling to stabilize. Will the consolidation lead to a bullish breakout?
Position: N/A
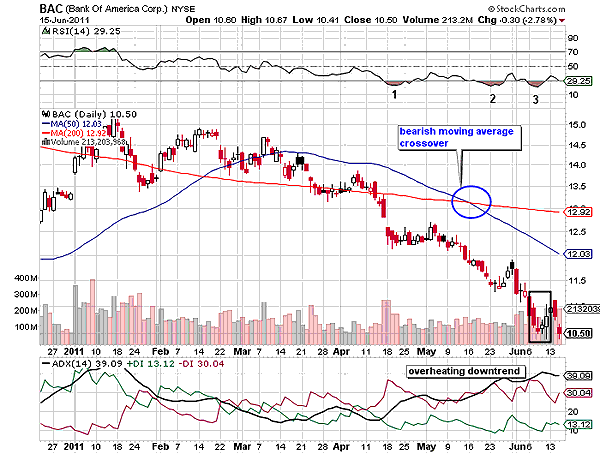
| Bank of America Corp (BAC) has been completely engulfed by the bearish force since past few months. In early 2011, BAC breached the robust 200-day moving average (MA) support, forming a series of lower lows. The stock has plunged to $10.50 in six months. The 50-day MA has slipped below the 200-day MA, indicating a bearish moving average crossover, reflecting the strong bearish force in the stock. The average directional movement index (ADX) (14) is highlighting a developing downtrend throughout the bearish rally. The relative strength index (RSI) (14) slipped below 50 levels as the stock began plunging below the 200-day MA support. |

|
| FIGURE 1: BAC, DAILY |
| Graphic provided by: StockCharts.com. |
| |
| Currently, BAC is consolidating at the lower low. The black block shows a bearish hammer, two dojis with small real bodies and lower as well as upper shadows. These candlesticks show possibility of an upcoming bullish force in the near future. The RSI (14) has formed triple bottoms, which is a bullish reversal formation, initiating a fresh bullish breakout. The downtrend is overheated, suggesting a trend reversal rally. However, we need to wait for more confirmation of the bullish rally. Although the RSI (14) has formed bullish reversal formation, the oscillator in Figure 1 looks a little weak to surge from an oversold region. The overheated downtrend would result in a consolidation as well. Therefore, BAC is likely to consolidate under these circumstances. We can see in Figure 1 that the price has moved sideways in a very narrow range. The stock would continue this journey till the indicator undergoes a rally in one particular direction. |

|
| FIGURE 2: BAC, WEEKLY |
| Graphic provided by: StockCharts.com. |
| |
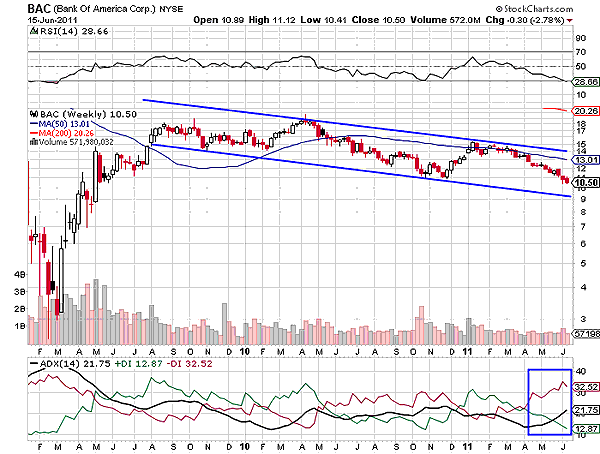
| The weekly time frame reveals the bearish picture of BAC. The stock has formed a descending channel in Figure 2. The upper trendline resistance was challenged in early 2010 and later in early 2011. After hitting the resistance, the stock drifted toward the lower trendline support. The lower trendline shows significant lower lows formed by the stock. The declining RSI (14) is ready to plunge in an oversold region, indicating more downside in the future. The downtrend in ADX (14) is developing. Hence, BAC would continue its bearish track. |
| Although BAC is consolidating on the daily time frame chart in Figure 1, the medium-term chart is bearish (Figure 2). Therefore, the bullish breakout is unlikely. Due to the highly bearish indicators on the daily chart, BAC could undergo a very short-term relief rally. In fact, the stock would plunge to the lower trendline support. To conclude, the long-term view of BAC remains bearish. |
Active trader in the Indian stock markets since 2003 and a full-time writer. Trading is largely based upon technical analysis.
| Company: | Independent |
| Address: | C1/3 Parth Indraprasth Towers. Vastrapur |
| Ahmedabad, Guj 380015 | |
| E-mail address: | chaitalimohile@yahoo.co.in |
Traders' Resource Links | |
| Independent has not added any product or service information to TRADERS' RESOURCE. | |
Click here for more information about our publications!
PRINT THIS ARTICLE

Request Information From Our Sponsors
- StockCharts.com, Inc.
- Candle Patterns
- Candlestick Charting Explained
- Intermarket Technical Analysis
- John Murphy on Chart Analysis
- John Murphy's Chart Pattern Recognition
- John Murphy's Market Message
- MurphyExplainsMarketAnalysis-Intermarket Analysis
- MurphyExplainsMarketAnalysis-Visual Analysis
- StockCharts.com
- Technical Analysis of the Financial Markets
- The Visual Investor
- VectorVest, Inc.
- Executive Premier Workshop
- One-Day Options Course
- OptionsPro
- Retirement Income Workshop
- Sure-Fire Trading Systems (VectorVest, Inc.)
- Trading as a Business Workshop
- VectorVest 7 EOD
- VectorVest 7 RealTime/IntraDay
- VectorVest AutoTester
- VectorVest Educational Services
- VectorVest OnLine
- VectorVest Options Analyzer
- VectorVest ProGraphics v6.0
- VectorVest ProTrader 7
- VectorVest RealTime Derby Tool
- VectorVest Simulator
- VectorVest Variator
- VectorVest Watchdog
