HOT TOPICS LIST
- MACD
- Fibonacci
- RSI
- Gann
- ADXR
- Stochastics
- Volume
- Triangles
- Futures
- Cycles
- Volatility
- ZIGZAG
- MESA
- Retracement
- Aroon
INDICATORS LIST
LIST OF TOPICS
PRINT THIS ARTICLE
by Mike Carr, CMT
This neglected indicator offers a profitable short-term trading strategy on the S&P 500.
Position: N/A
Mike Carr, CMT
Mike Carr, CMT, is a member of the Market Technicians Association, and editor of the MTA's newsletter, Technically Speaking. He is also the author of "Smarter Investing in Any Economy: The Definitive Guide to Relative Strength Investing," and "Conquering the Divide: How to Use Economic Indicators to Catch Stock Market Trends."
PRINT THIS ARTICLE
WILLIAM'S %R
Williams %R Offers Timely S&P 500 Trading Buys
06/17/11 08:22:01 AMby Mike Carr, CMT
This neglected indicator offers a profitable short-term trading strategy on the S&P 500.
Position: N/A
| Many technicians follow only the standard technical indicators. Relative strength index (RSI), stochastics, and moving average convergence/divergence (MACD) are popular. For decades, some technicians have debated whether the signals work because everyone follows them or if the signals work because they are identifying fundamental truths about the market. To those who have actually traded or tested the indicators, the conclusion is usually that they don't work as stand-alone, mechanical trading signals. |
| Larry Williams may not have been engaged in a decades-long debate about what works, but he has certainly been demonstrating what works for decades. His trading career now spans almost 50 years and longevity alone is a sign of success in this business. A prolific author, Williams has disclosed a large number of his strategies that anyone can test before putting real money at risk. |
| In 1973, he published "How I Made One Million Dollars... Last Year... Trading Commodities," which included the formula for %R. This indicator is designed to spot overbought and oversold extremes. The formula is: 100 * (Close - Lowest (Low , Bars used in calculation)) / (Highest (High , Bars used in calculation) - Lowest (Low , Bars used in calculation)) Williams recommends setting the number of bars used in the calculation to one half of the current dominant cycle in the market being traded. |
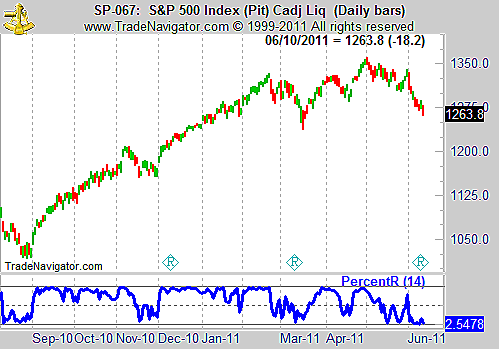
| A simple test shows this idea is a reliable trading tool. Figure 1 shows %R on the daily chart of the Standard & Poor's 500. A 14-period %R is shown, a value selected just to illustrate the concept rather than attempt to find the current cycle. The indicator is oversold near zero and overbought near 100. |

|
| FIGURE 1: S&P 500, DAILY. Williams %R is shown at the bottom of the S&P 500. With a current reading of 2.5, the indicator is oversold. |
| Graphic provided by: Trade Navigator. |
| |
| Testing was done using a buy signal when %R fell below 5. Again, this was just a value chosen as an example rather than an attempt at optimization. Using the futures contract and a one-day holding period, 60% of trades were winners. The average trade was an $800 win on an average of about nine trades a year. Trading the SPDR exchange traded fund (ETF) was also profitable. Using a next-day exit, the system delivered 47% winners, an average of about 10 trades a year, and a maximum intraday down equal to about a quarter of the total gains. All holding periods from one day to 20 days were profitable. Slippage of $45 a round turn was deducted from each trade in the test. Other markets and other parameters can be used to make %R a complete trading strategy. |
Mike Carr, CMT, is a member of the Market Technicians Association, and editor of the MTA's newsletter, Technically Speaking. He is also the author of "Smarter Investing in Any Economy: The Definitive Guide to Relative Strength Investing," and "Conquering the Divide: How to Use Economic Indicators to Catch Stock Market Trends."
| Website: | www.moneynews.com/blogs/MichaelCarr/id-73 |
| E-mail address: | marketstrategist@gmail.com |
Click here for more information about our publications!
Comments
Date: 06/21/11Rank: 4Comment:
Date: 06/28/11Rank: 4Comment:

|

Request Information From Our Sponsors
- StockCharts.com, Inc.
- Candle Patterns
- Candlestick Charting Explained
- Intermarket Technical Analysis
- John Murphy on Chart Analysis
- John Murphy's Chart Pattern Recognition
- John Murphy's Market Message
- MurphyExplainsMarketAnalysis-Intermarket Analysis
- MurphyExplainsMarketAnalysis-Visual Analysis
- StockCharts.com
- Technical Analysis of the Financial Markets
- The Visual Investor
- VectorVest, Inc.
- Executive Premier Workshop
- One-Day Options Course
- OptionsPro
- Retirement Income Workshop
- Sure-Fire Trading Systems (VectorVest, Inc.)
- Trading as a Business Workshop
- VectorVest 7 EOD
- VectorVest 7 RealTime/IntraDay
- VectorVest AutoTester
- VectorVest Educational Services
- VectorVest OnLine
- VectorVest Options Analyzer
- VectorVest ProGraphics v6.0
- VectorVest ProTrader 7
- VectorVest RealTime Derby Tool
- VectorVest Simulator
- VectorVest Variator
- VectorVest Watchdog
