HOT TOPICS LIST
- MACD
- Fibonacci
- RSI
- Gann
- ADXR
- Stochastics
- Volume
- Triangles
- Futures
- Cycles
- Volatility
- ZIGZAG
- MESA
- Retracement
- Aroon
INDICATORS LIST
LIST OF TOPICS
PRINT THIS ARTICLE
by Koos van der Merwe
We all know that the year ahead until the Presidential elections is going to be a nail-biter.
Position: Accumulate
Koos van der Merwe
Has been a technical analyst since 1969, and has worked as a futures and options trader with First Financial Futures in Johannesburg, South Africa.
PRINT THIS ARTICLE
ELLIOTT WAVE
Which One Is The Correct Count?
06/17/11 12:13:07 PMby Koos van der Merwe
We all know that the year ahead until the Presidential elections is going to be a nail-biter.
Position: Accumulate
| My long-term forecast for the year ahead is a gradual saucer-shaped fall, bottoming sometime in October-December 2012. We all know that the economy is struggling, and with the bears of the US like Nouriel Roubini calling for a double-dip recession, investors are scared to buy into the market and I don't blame them. Elliott wave counts of the indexes can be confusing, and direction is not easy to see. At the moment, we can only guess and rely on well-known indicators to assist in a forecast. So let us have a look at two possibilities -- a signpost where we will either turn left or right. |

|
| FIGURE 1: DJIA, WAVE COUNT 1 |
| Graphic provided by: AdvancedGET. |
| |
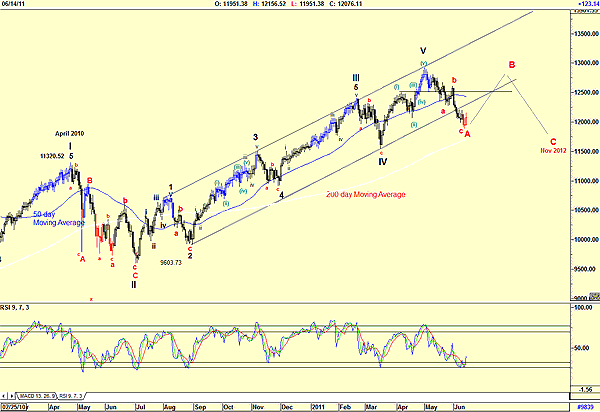
| Figure 1, a daily chart, suggests that wave V is complete, and that the Dow Jones Industrial Average (DJIA) is currently tracing an ABC correction that will end sometime in November next year. How accurate is this count? We can only make an assumption, based on the fact that the DJIA has broken its support line. This gives credence to calling the present down move an A-wave, with the buy given by the relative strength index (RSI) suggesting that a B-wave up could be in the making. Do note as well that the DJIA is still above its 200-day moving average, and that situation to many is a positive sign. Do note that I have used a nine-period RSI. |

|
| FIGURE 2: DJIA, WAVE COUNT 2 |
| Graphic provided by: AdvancedGET. |
| |
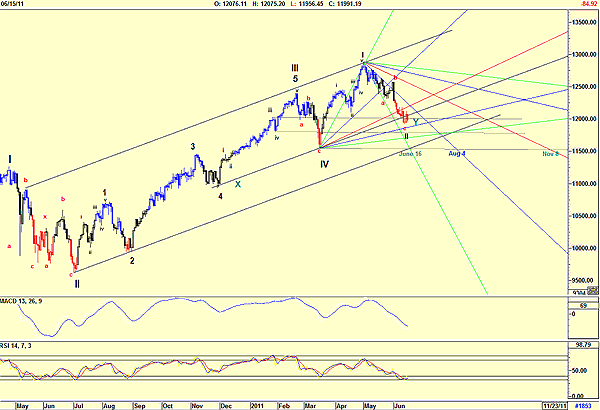
| Figure 2 shows the daily DJIA but with a different wave count. This count suggests that the DJIA has traced wave II of wave V. Note the following: a. The wave II correction is within the fourth wave of lesser degree. b. The main support line has been shown to be far lower than in Figure 1, and has not been tested. However, the interim trend line, X-Y, drawn parallel to the main support line from the low at X has been broken. c. Once again, the RSI is suggesting a buy. This time I looked at a 14-period RSI. d. The MACD is still suggesting weakness. e. The Gann fan is drawn from the high of wave I of wave V is suggesting a turning point upward on June 16 that could last until August 14. To guess which count is the correct count will resolve itself over time. Whatever the count is, the short-term trend is up. The difference between the two charts is that the one is suggesting a limited rise in a wave B and the other a strong rise in a wave III. I have always stated that one should buy the shares you would like to own as the index bottoms. I have not changed my opinion, but, the results of those buys could be nail-biting. |
Has been a technical analyst since 1969, and has worked as a futures and options trader with First Financial Futures in Johannesburg, South Africa.
| Address: | 3256 West 24th Ave |
| Vancouver, BC | |
| Phone # for sales: | 6042634214 |
| E-mail address: | petroosp@gmail.com |
Click here for more information about our publications!
PRINT THIS ARTICLE

|

Request Information From Our Sponsors
- StockCharts.com, Inc.
- Candle Patterns
- Candlestick Charting Explained
- Intermarket Technical Analysis
- John Murphy on Chart Analysis
- John Murphy's Chart Pattern Recognition
- John Murphy's Market Message
- MurphyExplainsMarketAnalysis-Intermarket Analysis
- MurphyExplainsMarketAnalysis-Visual Analysis
- StockCharts.com
- Technical Analysis of the Financial Markets
- The Visual Investor
- VectorVest, Inc.
- Executive Premier Workshop
- One-Day Options Course
- OptionsPro
- Retirement Income Workshop
- Sure-Fire Trading Systems (VectorVest, Inc.)
- Trading as a Business Workshop
- VectorVest 7 EOD
- VectorVest 7 RealTime/IntraDay
- VectorVest AutoTester
- VectorVest Educational Services
- VectorVest OnLine
- VectorVest Options Analyzer
- VectorVest ProGraphics v6.0
- VectorVest ProTrader 7
- VectorVest RealTime Derby Tool
- VectorVest Simulator
- VectorVest Variator
- VectorVest Watchdog
