HOT TOPICS LIST
- MACD
- Fibonacci
- RSI
- Gann
- ADXR
- Stochastics
- Volume
- Triangles
- Futures
- Cycles
- Volatility
- ZIGZAG
- MESA
- Retracement
- Aroon
INDICATORS LIST
LIST OF TOPICS
PRINT THIS ARTICLE
by Donald W. Pendergast, Jr.
With the S&P 500 at or near a potentially strong support area, now is the time to look for quick in-and-out long trade setups.
Position: Buy
Donald W. Pendergast, Jr.
Donald W. Pendergast is a financial markets consultant who offers specialized services to stock brokers and high net worth individuals who seek a better bottom line for their portfolios.
PRINT THIS ARTICLE
TRADING SYSTEMS
Ecolab, A Stock That's Bucking The Trend
06/16/11 11:37:30 AMby Donald W. Pendergast, Jr.
With the S&P 500 at or near a potentially strong support area, now is the time to look for quick in-and-out long trade setups.
Position: Buy
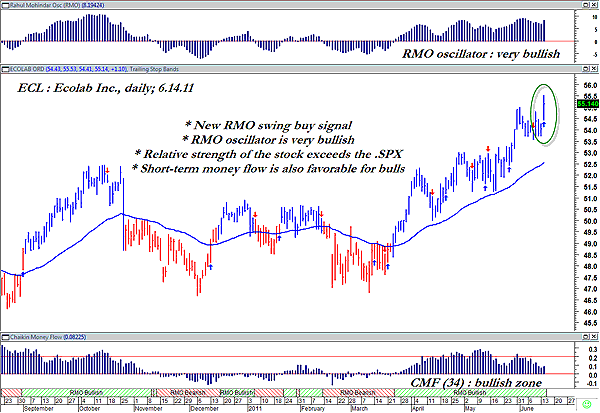
| An interesting and sometimes effective market tactic involves scanning for strong relative strength stocks after the broad markets have sold off hard, located a strong support area, and then show some follow-though with a bullish reversal bar. Here's a look at the daily chart of one such stock that was located by means of such a scan in the wake of a major market reversal and subsequent bounce from support (Figure 1). |

|
| FIGURE 1: ECL, DAILY. Even in down markets, there always seem to be stocks that are willing and able to buck the dominant trend. |
| Graphic provided by: MetaStock. |
| Graphic provided by: Rahul Mohindar (RMO) indicator from MetaStock 11. |
| |
| Shares of Ecolab, Inc. (ECL), are not only stronger than the .SPX over the past 13 weeks, they have just fired a new Rahul Mohindar oscillator (RMO) swing buy signal that appears to also have powerful momentum (top of chart) and money flow dynamics (bottom of chart) working strongly in the buy signal's favor as well. |
| Trading bounces in what may yet prove to be a corrective move with more downside ahead may not be everyone's cup of tea, but it may yet offer the opportunity to profit if a modest retracement rally ensues for the next few sessions. Stock traders might look to enter long on a break above Tuesday's high of $55.53 and then run a two- to three-bar trailing stop of the daily lows as the initial protective trail stop for the position. As far as trading puts or calls in ECL shares goes, the bid-ask spreads are very poor and leave a lot to be desired, meaning that taking the straight stock trade entry is the preferred way to play this stock. No one knows if June 14's reversal was a one-day wonder or if it kicked off the start of a multi-session relief rally. By focusing on the strongest relative strength issues in the broad market, however, you can put better odds for success on your side. Set up your own 13-, 26-, and 52-week comparative relative strength scans in your own charting software and watch how it can help you find the most appropriate stocks in any given market setting. |
Donald W. Pendergast is a financial markets consultant who offers specialized services to stock brokers and high net worth individuals who seek a better bottom line for their portfolios.
| Title: | Writer, market consultant |
| Company: | Linear Trading Systems LLC |
| Jacksonville, FL 32217 | |
| Phone # for sales: | 904-239-9564 |
| E-mail address: | lineartradingsys@gmail.com |
Traders' Resource Links | |
| Linear Trading Systems LLC has not added any product or service information to TRADERS' RESOURCE. | |
Click here for more information about our publications!
PRINT THIS ARTICLE

Request Information From Our Sponsors
- StockCharts.com, Inc.
- Candle Patterns
- Candlestick Charting Explained
- Intermarket Technical Analysis
- John Murphy on Chart Analysis
- John Murphy's Chart Pattern Recognition
- John Murphy's Market Message
- MurphyExplainsMarketAnalysis-Intermarket Analysis
- MurphyExplainsMarketAnalysis-Visual Analysis
- StockCharts.com
- Technical Analysis of the Financial Markets
- The Visual Investor
- VectorVest, Inc.
- Executive Premier Workshop
- One-Day Options Course
- OptionsPro
- Retirement Income Workshop
- Sure-Fire Trading Systems (VectorVest, Inc.)
- Trading as a Business Workshop
- VectorVest 7 EOD
- VectorVest 7 RealTime/IntraDay
- VectorVest AutoTester
- VectorVest Educational Services
- VectorVest OnLine
- VectorVest Options Analyzer
- VectorVest ProGraphics v6.0
- VectorVest ProTrader 7
- VectorVest RealTime Derby Tool
- VectorVest Simulator
- VectorVest Variator
- VectorVest Watchdog
