HOT TOPICS LIST
- MACD
- Fibonacci
- RSI
- Gann
- ADXR
- Stochastics
- Volume
- Triangles
- Futures
- Cycles
- Volatility
- ZIGZAG
- MESA
- Retracement
- Aroon
INDICATORS LIST
LIST OF TOPICS
PRINT THIS ARTICLE
by Billy Williams
Breakout trading can be both exciting and profitable, but if you lack five key lessons, it can bleed your trading account dry. Learn how to be on the right side of breakout trading.
Position: Hold
Billy Williams
Billy Williams has been trading the markets for 27 years, specializing in momentum trading with stocks and options.
PRINT THIS ARTICLE
STRATEGIES
Five Tips For Successful Breakout Trading
06/16/11 12:21:18 PMby Billy Williams
Breakout trading can be both exciting and profitable, but if you lack five key lessons, it can bleed your trading account dry. Learn how to be on the right side of breakout trading.
Position: Hold
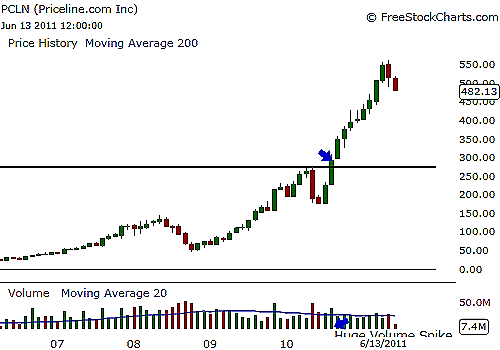
| Breakout trading is synonymous with momentum trading because of the explosive price action that occurs when price makes a runaway move as a new trend emerges. Like the calm before the storm, breakout moves often occur just as price remains inert for long periods, trading back and forth in a contracted range, only to explode suddenly like a volcano. This makes breakout trading one of the most exciting approaches to trade, as the move attracts legions of traders who had been sitting on the sidelines but rush in once the move occurs so they are not left out as price moves forcefully in a given direction. Not just exciting, but breakout trading is also highly effective for achieving superior gains than many methods because this approach capitalizes on the concept of momentum and velocity. For a trader, momentum is a factor of acceleration in how fast price moves and also the time frame that it makes the move. For example, a stock that accelerates 20 points in a week is far more attractive to a breakout trader than a stock that moves 20 points in a year, simply because you can achieve superior returns within a short length of time. In addition, the principle of velocity is predicated upon the underlying principle of momentum; velocity dictates how quickly you can turn a profit and then move from cash to asset to cash and repeat the cycle. Based on the example, if you can turn a profit of 20 points within a week, take profits and move to cash and then repeat week after week, you will achieve far greater returns because you can turn over your investment capital at a superior level of turnover. This is not possible all the time, but the underlying message of velocity is that the faster you can make money, take profits and move to cash and then repeat, the higher your potential return over a given length of time. See Figures 1 and 2. |

|
| FIGURE 1: PCLN. In this five-year chart, PCLN has surged upward in an uptrend with no overhead resistance to create a drag on its bull run. |
| Graphic provided by: www.freestockcharts.com. |
| |
| Most traders, however, who understand these principles still run into trouble with the execution of effective breakout trading because they lack the understanding of the fundamentals of the method. Worse, the very characteristics that make breakout trading so effective -- accelerated gains and quick turnover of profits -- can also work against you if you get the sequence of steps out of order. The consequences are accelerated losses and an even faster turnover of losses in your trading account. Fortunately, there are five tips to breakout trading that can keep you on the right side of the trade sequence and avoid the fast bleed of losses to your investment capital. First, always trade in the direction of the general market. Around 70% to 80% of stocks move in tandem with general market, particularly the Standard & Poor's 500 (.SPX). The SPX is composed of the largest 500 publicly traded companies in the US and is a major factor in influencing the price action of the individual stocks that make up its index. |

|
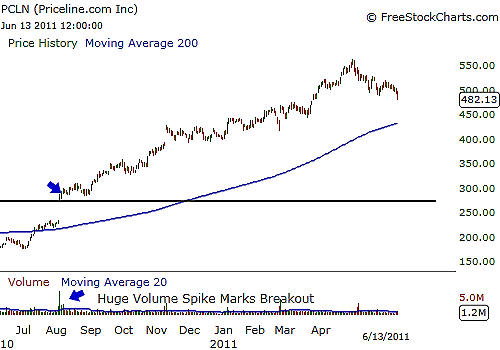
| FIGURE 2: PCLN. Here on PCLN's one-year chart, price explodes through a resistance point on higher volume at the same time the overall market is in a bull run at the same time. These key factors make for a high-probability breakout as PCLN goes on to gain almost 100% from the point of its breakout. |
| Graphic provided by: www.freestockcharts.com. |
| |
| Second, look for stocks that trade at or near their five-year highs. Stocks that are trading at these price levels do not have any overhead resistance, which are pockets where previous buyers lurk. These buyers had purchased the stock and held on even as the overall market continued to fall, taking the price of their stock with it. These die-hard investors refused to sell at a loss and decided at some point to hang on rather than take a loss. As soon as price hits its old level, investors will liquidate their shares to break even and if there are a sufficiently large-enough group of these investors, they can cause a drag on price and hamper the trend of the stock's price. By avoiding these types of stocks and being selective of stocks at five-year highs, you can avoid this type of ill effect on price and focus on stocks that are likely to continue in the direction of their dominant trend without being dragged down by overhead resistance. |
| Third, focus on stocks that have high relative strength (RS). RS is an indicator that ranks stocks from a low of 1 being the weakest to a high of 100 being the strongest. This ranking is a comparative value, revealing how strong the stock is performing in comparison to the overall market. Stick to high RS stocks, since they not only perform better but can also reveal which stocks are leaders in the market and are likely to take the market to new higher highs as a result. Fourth, understand the function of price and volume in relationship to each other. Volume is to the stock market what rocket fuel is to the Space Shuttle. It is the fuel that drives the market higher or lower and reveals who is in control of a stock -- buyers or sellers -- by being able to read the ebb and flow of trading volume into a stock and how that stock's price reacts to that surge in volume. Finally, fifth, spend time learning how to spot high-probability price patterns within a stock's price action. Spend time studying charts and identifying the price patterns that form within a stock's price action. |
| Price patterns are a reflection of the investment psychology being played out by the investors and traders in a stock. The close study of price patterns, such as a cup & handle pattern, reveal key patterns that can clue you in as to when a breakout move is about to be under way as well as indicate the perfect time to enter a position just as it explodes into a high-powered trend. These five tips can help you stay on the right side of a winning trade just before a stock has a runaway move while avoiding the frustrating false moves that are common in the stock market. By taking these key steps to heart and spending time mastering the basic lessons within each, you increase your ability to spot breakout trades as they begin, enter at the precise time, and profit handsomely while avoiding unnecessary losses that other traders with less training fall prey to. |
Billy Williams has been trading the markets for 27 years, specializing in momentum trading with stocks and options.
| Company: | StockOptionSystem.com |
| E-mail address: | stockoptionsystem.com@gmail.com |
Traders' Resource Links | |
| StockOptionSystem.com has not added any product or service information to TRADERS' RESOURCE. | |
Click here for more information about our publications!
PRINT THIS ARTICLE

|

Request Information From Our Sponsors
- StockCharts.com, Inc.
- Candle Patterns
- Candlestick Charting Explained
- Intermarket Technical Analysis
- John Murphy on Chart Analysis
- John Murphy's Chart Pattern Recognition
- John Murphy's Market Message
- MurphyExplainsMarketAnalysis-Intermarket Analysis
- MurphyExplainsMarketAnalysis-Visual Analysis
- StockCharts.com
- Technical Analysis of the Financial Markets
- The Visual Investor
- VectorVest, Inc.
- Executive Premier Workshop
- One-Day Options Course
- OptionsPro
- Retirement Income Workshop
- Sure-Fire Trading Systems (VectorVest, Inc.)
- Trading as a Business Workshop
- VectorVest 7 EOD
- VectorVest 7 RealTime/IntraDay
- VectorVest AutoTester
- VectorVest Educational Services
- VectorVest OnLine
- VectorVest Options Analyzer
- VectorVest ProGraphics v6.0
- VectorVest ProTrader 7
- VectorVest RealTime Derby Tool
- VectorVest Simulator
- VectorVest Variator
- VectorVest Watchdog
