HOT TOPICS LIST
- MACD
- Fibonacci
- RSI
- Gann
- ADXR
- Stochastics
- Volume
- Triangles
- Futures
- Cycles
- Volatility
- ZIGZAG
- MESA
- Retracement
- Aroon
INDICATORS LIST
LIST OF TOPICS
PRINT THIS ARTICLE
by Alan R. Northam
Statistical analysis is used to show that the S&P 500 has reversed its intermediate-term trend from a bullish trend to a bearish trend.
Position: N/A
Alan R. Northam
Alan Northam lives in the Dallas, Texas area and as an electronic engineer gave him an analytical mind from which he has developed a thorough knowledge of stock market technical analysis. His abilities to analyze the future direction of the stock market has allowed him to successfully trade of his own portfolio over the last 30 years. Mr. Northam is now retired and trading the stock market full time. You can reach him at inquiry@tradersclassroom.com or by visiting his website at http://www.tradersclassroom.com. You can also follow him on Twitter @TradersClassrm.
PRINT THIS ARTICLE
STATISTICS
S&P 500 Turns Into A Bear
06/16/11 08:17:10 AMby Alan R. Northam
Statistical analysis is used to show that the S&P 500 has reversed its intermediate-term trend from a bullish trend to a bearish trend.
Position: N/A
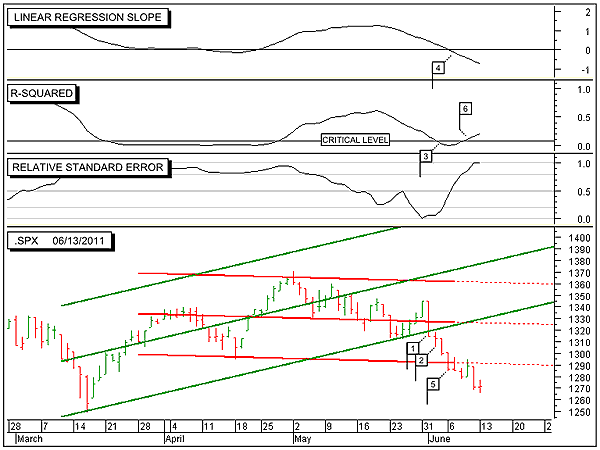
| The bottom panel of Figure 1 shows the daily bar chart of the Standard & Poor's 500 (.SPX). The bottom panel also shows two linear regression trend lines along with their respective two sigma channel lines, one in green and one in red. Let us first address the green upsloping linear regression trendline and its upper and lower channel lines. The green upsloping linear regression trendline (middle green line) represents the intermediate-term trend from mid-March to late May. Note that during this time, the daily price bars of the S&P 500 have been trading within the upper and lower channel lines. Note also that on June 1, the S&P 500 closed below the lower green channel line (flag 1) to flash a warning that the upward intermediate-term trend of the S&P 500 was about to change. On June 2, we saw some follow-through, with the complete daily trading range below the lower green channel line (flag 2). The following day, on June 3, the R-squared indicator moved below its critical level (flag 3), indicating that there was no longer a significant uptrend in progress. The two days later, on June 7, the intermediate-term trend reversed from an uptrend to a downtrend when the linear regression slope indicator in the top panel of Figure 1 moved below its zero line (flag 4). |

|
| FIGURE 1: .SPX, DAILY. This chart shows the daily price chart of the S&P 500 in the bottom panel along with the 50-day intermediate-term linear regression trendlines and their respective upper and lower channel lines, with the linear regression slope indicator in the top panel, the R-squared indicator in the second panel, and the relative standard error index (RSEI) in the third. |
| Graphic provided by: MetaStock. |
| |
| Once we have a trend reversal, it is time to add the downsloping 50-day linear regression trendline and its upper and lower two sigma channel lines, which I have shown in red. I have extended these lines as shown by the red dotted lines. Note also that on the same day, the linear regression slope indicator moved below its zero line, the S&P 500 also moved below the lower red downsloping channel line (flag 5) to signal that the S&P 500 was now starting to accelerate in price downward. Then two days later, on June 9, the R-squared indicator moved above its critical level (flag 6), signaling that there now exists a 95% confidence level that the newly established intermediate-term downtrend will continue. |
| In conclusion, this sequence of events shows the typical steps that a stock or market index goes through in reversing its trend and shows that the S&P 500 has now reversed its intermediate-term trend from an uptrend to a downtrend. The one remaining step to take place would be the relative standard error index (RSEI) moving below 0.2. This final step will confirm that the S&P 500 is well on its way to moving lower. Should the RSEI remain above 0.5, it will be a signal that the newly established intermediate-term downtrend for the S&P 500 may not last very long. So the relative standard error index is an important indicator to watch. |
Alan Northam lives in the Dallas, Texas area and as an electronic engineer gave him an analytical mind from which he has developed a thorough knowledge of stock market technical analysis. His abilities to analyze the future direction of the stock market has allowed him to successfully trade of his own portfolio over the last 30 years. Mr. Northam is now retired and trading the stock market full time. You can reach him at inquiry@tradersclassroom.com or by visiting his website at http://www.tradersclassroom.com. You can also follow him on Twitter @TradersClassrm.
| Garland, Tx | |
| Website: | www.tradersclassroom.com |
| E-mail address: | inquiry@tradersclassroom.com |
Click here for more information about our publications!
PRINT THIS ARTICLE

Request Information From Our Sponsors
- StockCharts.com, Inc.
- Candle Patterns
- Candlestick Charting Explained
- Intermarket Technical Analysis
- John Murphy on Chart Analysis
- John Murphy's Chart Pattern Recognition
- John Murphy's Market Message
- MurphyExplainsMarketAnalysis-Intermarket Analysis
- MurphyExplainsMarketAnalysis-Visual Analysis
- StockCharts.com
- Technical Analysis of the Financial Markets
- The Visual Investor
- VectorVest, Inc.
- Executive Premier Workshop
- One-Day Options Course
- OptionsPro
- Retirement Income Workshop
- Sure-Fire Trading Systems (VectorVest, Inc.)
- Trading as a Business Workshop
- VectorVest 7 EOD
- VectorVest 7 RealTime/IntraDay
- VectorVest AutoTester
- VectorVest Educational Services
- VectorVest OnLine
- VectorVest Options Analyzer
- VectorVest ProGraphics v6.0
- VectorVest ProTrader 7
- VectorVest RealTime Derby Tool
- VectorVest Simulator
- VectorVest Variator
- VectorVest Watchdog
