HOT TOPICS LIST
- MACD
- Fibonacci
- RSI
- Gann
- ADXR
- Stochastics
- Volume
- Triangles
- Futures
- Cycles
- Volatility
- ZIGZAG
- MESA
- Retracement
- Aroon
INDICATORS LIST
LIST OF TOPICS
PRINT THIS ARTICLE
by Donald W. Pendergast, Jr.
While the price of gold has been hanging on to the majority of the gains made during its massive decade-long run, the values of gold stocks have already begun a significant corrective process.
Position: N/A
Donald W. Pendergast, Jr.
Donald W. Pendergast is a financial markets consultant who offers specialized services to stock brokers and high net worth individuals who seek a better bottom line for their portfolios.
PRINT THIS ARTICLE
REL. STR COMPARATIVE
Fidelity Select Gold A Lagging Fund?
06/15/11 01:10:53 PMby Donald W. Pendergast, Jr.
While the price of gold has been hanging on to the majority of the gains made during its massive decade-long run, the values of gold stocks have already begun a significant corrective process.
Position: N/A
| Those of you who have read my articles here in Traders.com Advantage for any length of time are already aware that the technical charting of support and resistance areas is perhaps the single most important and useful tool of all for discretionary traders to be aware of. Prices regularly rise and fall within certain boundary zones such as prior swing highs/lows, Keltner/Bollinger band extremes, floor trader pivots points, trend lines and Fibonacci confluence zones -- and when such boundaries are exceeded in powerful, thrusting breakout moves on heavy volume, it can be a good tipoff that prices are in search of a new zone of equilibrium, sometimes in a hurry, no less. |

|
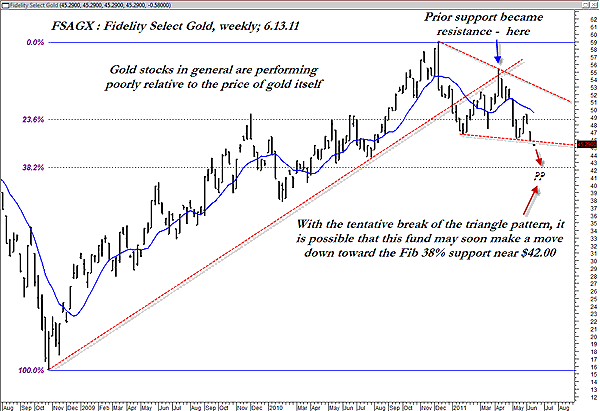
| FIGURE 1: FSAGX, WEEKLY. Support and resistance areas such as major trendlines and triangle patterns can frequently help discretionary traders to better capitalize on profitable trading opportunities. |
| Graphic provided by: MetaStock. |
| |
| As we scan in Figure 1, a weekly chart of the Fidelity Select Gold fund (FSAGX), we note that the long-term uptrend line established at the major 2008 lows was initially broken in early 2011, after which a reaction rally pulled prices higher up to the lower side of the prior uptrend line (see blue arrow on chart), at which point the rally failed and the correction/reversal continued to gradually drag prices lower. In doing so, a fairly legible triangle pattern was formed, one that may have begun to break down this week. Since the Fibonacci 23.6% retracement of the massive 2008-10 runup in FSAGX has already given way (big time), and since the broad US markets are already ensconced in a powerful summer correction -- with gold stocks going along for the ride in full agreement, apparently -- there appears to be a very high probability that the Fibonacci 38.2% support area near $42 may be the next tentative target price for this popular precious metals mutual fund. The summer months are typically not kind to precious metals investors anyway, so it might pay for patient gold bugs to wait for this current chart pattern to play out and then give a valid signal of a bullish reversal before attempting to load up on gold stocks once again. |
| "Big" Fibonacci numbers like the 38.2%, 50%, and the 61.8% retracements can typically be expected to offer some measure of meaningful support/resistance, especially when approached on the reverse side of a major trend-following move that has peaked out. This potential support zone near $42 in FSAGX could also offer some opportunities, particularly if the gold market and the stock market decide that a midsummer rally is just what the doctor ordered. Use this chart as a general guide and then drill down to check out the price action on some of the major gold stocks like Goldcorp (GG), Newmont (NEM), and Barrick (ABX) to see if you can't spot some excellent reversal setups on your own in the next few weeks. It might prove to be time well-spent. |
Donald W. Pendergast is a financial markets consultant who offers specialized services to stock brokers and high net worth individuals who seek a better bottom line for their portfolios.
| Title: | Writer, market consultant |
| Company: | Linear Trading Systems LLC |
| Jacksonville, FL 32217 | |
| Phone # for sales: | 904-239-9564 |
| E-mail address: | lineartradingsys@gmail.com |
Traders' Resource Links | |
| Linear Trading Systems LLC has not added any product or service information to TRADERS' RESOURCE. | |
Click here for more information about our publications!
PRINT THIS ARTICLE

Request Information From Our Sponsors
- StockCharts.com, Inc.
- Candle Patterns
- Candlestick Charting Explained
- Intermarket Technical Analysis
- John Murphy on Chart Analysis
- John Murphy's Chart Pattern Recognition
- John Murphy's Market Message
- MurphyExplainsMarketAnalysis-Intermarket Analysis
- MurphyExplainsMarketAnalysis-Visual Analysis
- StockCharts.com
- Technical Analysis of the Financial Markets
- The Visual Investor
- VectorVest, Inc.
- Executive Premier Workshop
- One-Day Options Course
- OptionsPro
- Retirement Income Workshop
- Sure-Fire Trading Systems (VectorVest, Inc.)
- Trading as a Business Workshop
- VectorVest 7 EOD
- VectorVest 7 RealTime/IntraDay
- VectorVest AutoTester
- VectorVest Educational Services
- VectorVest OnLine
- VectorVest Options Analyzer
- VectorVest ProGraphics v6.0
- VectorVest ProTrader 7
- VectorVest RealTime Derby Tool
- VectorVest Simulator
- VectorVest Variator
- VectorVest Watchdog
