HOT TOPICS LIST
- MACD
- Fibonacci
- RSI
- Gann
- ADXR
- Stochastics
- Volume
- Triangles
- Futures
- Cycles
- Volatility
- ZIGZAG
- MESA
- Retracement
- Aroon
INDICATORS LIST
LIST OF TOPICS
PRINT THIS ARTICLE
by Mike Carr, CMT
Coal has been a leader in this bull market but now it is showing signs of topping, along with the rest of the market.
Position: Sell
Mike Carr, CMT
Mike Carr, CMT, is a member of the Market Technicians Association, and editor of the MTA's newsletter, Technically Speaking. He is also the author of "Smarter Investing in Any Economy: The Definitive Guide to Relative Strength Investing," and "Conquering the Divide: How to Use Economic Indicators to Catch Stock Market Trends."
PRINT THIS ARTICLE
STOCHASTICS
Coal Slumping
06/15/11 08:28:57 AMby Mike Carr, CMT
Coal has been a leader in this bull market but now it is showing signs of topping, along with the rest of the market.
Position: Sell
| Oil meets the bulk of the world's energy demands, but coal is the chief source of electricity in the US and in many other countries. Demand for coal has been steadily increasing, and technology has made it less harmful to the environment. Yet coal seems to have largely escaped the notice of many investors. As the economy grows, demand for coal and the price of coal will go up. Lower prices for coal would be a sign of a slowing economy. |
| Market Vectors Coal exchange traded fund (ETF) (KOL) has total assets of almost $900 million, less than half the assets of United States Natural Gas ETF (UNG). Yet KOL climbed up more than 450% from the March 2009 stock bottom. It delivered not only gains, but volatility as well, which is to be expected with such a big gainer. During the past two years, KOL suffered three separate declines of at least 20%, and its standard deviation was 2.5 times that of the Standard & Poor's 500. Standard deviation is a good measure of volatility and a commonly used risk metric. |
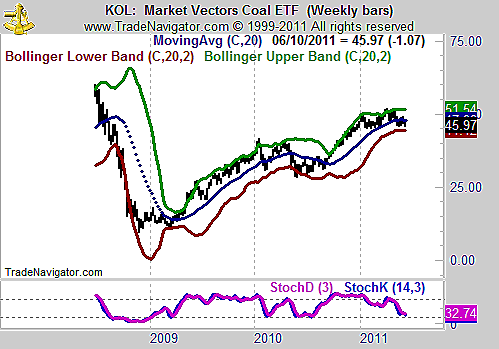
| The weekly chart (Figure 1) shows a long-term topping pattern. Prices have moved within a narrow range since the start of the year, forming a tight rectangle pattern. Price projects to 40 on a downside break. |

|
| FIGURE 1: KOL, WEEKLY. Here, this chart shows prices approaching the lower Bollinger band, and the stochastic moving lower. |
| Graphic provided by: Trade Navigator. |
| |
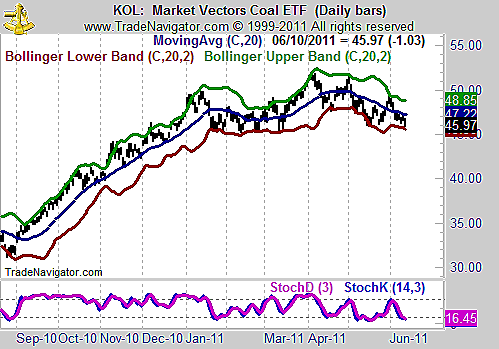
| The daily chart (Figure 2) is equally bearish. All momentum indicators point lower, and the stochastic shows a bearish crossover. The upper Bollinger band has proven to be a good resistance line for price and is now pointed down. Upside should be limited to that line, and the downside risk now exceeds the upside targets for KOL. |

|
| FIGURE 2: KOL, DAILY. Figure 2: The daily stochastics for KOL are also falling. |
| Graphic provided by: Trade Navigator. |
| |
| Market leaders in bull markets often lead to the downside as markets change trend. KOL should be watched closely, as a downside break would indicate fundamental economic weakness and a potential bear market in stocks. |
Mike Carr, CMT, is a member of the Market Technicians Association, and editor of the MTA's newsletter, Technically Speaking. He is also the author of "Smarter Investing in Any Economy: The Definitive Guide to Relative Strength Investing," and "Conquering the Divide: How to Use Economic Indicators to Catch Stock Market Trends."
| Website: | www.moneynews.com/blogs/MichaelCarr/id-73 |
| E-mail address: | marketstrategist@gmail.com |
Click here for more information about our publications!
PRINT THIS ARTICLE

Request Information From Our Sponsors
- StockCharts.com, Inc.
- Candle Patterns
- Candlestick Charting Explained
- Intermarket Technical Analysis
- John Murphy on Chart Analysis
- John Murphy's Chart Pattern Recognition
- John Murphy's Market Message
- MurphyExplainsMarketAnalysis-Intermarket Analysis
- MurphyExplainsMarketAnalysis-Visual Analysis
- StockCharts.com
- Technical Analysis of the Financial Markets
- The Visual Investor
- VectorVest, Inc.
- Executive Premier Workshop
- One-Day Options Course
- OptionsPro
- Retirement Income Workshop
- Sure-Fire Trading Systems (VectorVest, Inc.)
- Trading as a Business Workshop
- VectorVest 7 EOD
- VectorVest 7 RealTime/IntraDay
- VectorVest AutoTester
- VectorVest Educational Services
- VectorVest OnLine
- VectorVest Options Analyzer
- VectorVest ProGraphics v6.0
- VectorVest ProTrader 7
- VectorVest RealTime Derby Tool
- VectorVest Simulator
- VectorVest Variator
- VectorVest Watchdog
