

HOT TOPICS LIST
- MACD
- Fibonacci
- RSI
- Gann
- ADXR
- Stochastics
- Volume
- Triangles
- Futures
- Cycles
- Volatility
- ZIGZAG
- MESA
- Retracement
- Aroon
INDICATORS LIST
LIST OF TOPICS
PRINT THIS ARTICLE
by Alan R. Northam
Statistical analysis show the Proshares Short SmallCap 600 ETF (SBB) has now started its first upward leg.
Position: N/A
Alan R. Northam
Alan Northam lives in the Dallas, Texas area and as an electronic engineer gave him an analytical mind from which he has developed a thorough knowledge of stock market technical analysis. His abilities to analyze the future direction of the stock market has allowed him to successfully trade of his own portfolio over the last 30 years. Mr. Northam is now retired and trading the stock market full time. You can reach him at inquiry@tradersclassroom.com or by visiting his website at http://www.tradersclassroom.com. You can also follow him on Twitter @TradersClassrm.
PRINT THIS ARTICLE
STATISTICS
Short SmallCap 600 Starts Uptrend
06/15/11 12:19:16 PMby Alan R. Northam
Statistical analysis show the Proshares Short SmallCap 600 ETF (SBB) has now started its first upward leg.
Position: N/A
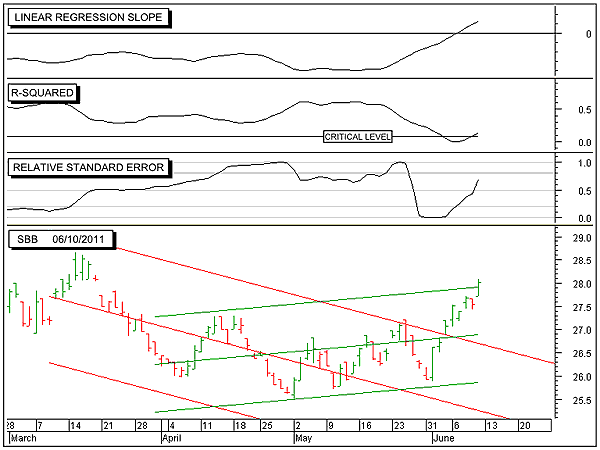
| The bottom panel of Figure 1 is that of the Proshares Short SmallCap 600 exchange traded fund (SBB). This panel also shows the 50-day linear regression line (middle downsloping red line) along with its upper and lower two sigma channel lines. The linear regression line represents the trend and is often referred to as the linear regression trendline. The upper and lower two sigma channel lines represent the range in which price moves 95% of the time. In the majority of cases, once price moves outside the two sigma channel lines, it signals a high probability that a change in trend is taking place. However, on occasion, price will move back inside the two sigma channel lines to continue in its current trend. The reason is that 5% of the time, it is statistically valid for price to move outside this range before moving back toward its trendline. Note in Figure 1 that on late May 25, price did move outside the upper two sigma channel line during the session but then quickly moved back inside the channel. During the first of June, however, price did successfully move outside the red upper channel line and is continuing to move higher. |
|
| FIGURE 1: SBB, DAILY. This chart shows the daily price chart of the Proshares Short SmallCap ETF (SBB) in the bottom panel along with the 50-day intermediate term linear regression trendlines and their associated upper and lower two sigma channel lines, the linear regression slope indicator in the top panel, the R-squared indicator in the second panel, and the relative standard error Index (RSEI) in the third. |
| Graphic provided by: MetaStock. |
| |
| The top panel of Figure 1 shows the linear regression slope indicator. This indicator shows that on June 7, this indicator moved above its zero line, signaling a reversal in the 50-day linear regression trendline from down to up and represents a change in the intermediate-term trend of TWM. This change in trend from down to up can also be seen in the bottom panel shown as a green upsloping linear regression trendline. Note also that price has now moved up to the green upsloping linear regression channel line. This upper channel line acts as a line of resistance where the lower channel line acts as support. With price now at the upper channel line, two things can happen: price can either bounce off the channel line and move back downward and towards the green linear regression trendline (middle green line), or price can break out above the channel line in a show of strength and continue higher. To resolve this dilemma, I often move to a smaller time frame and redo my statistical analysis. However, a second option is to observe the last trading bar. Note that this bar is tall, opened at the bottom of its range, and closed near the top. This is a good indication that price will continue to move higher in the days ahead. |
| The next window down from the top is that of the R-squared Indicator. The R-squared indicator is a statistical measure of the strength of the trend. Note that this indicator has now moved above its critical level, indicating that there is now a 95% confidence level that the newly established intermediate-term uptrend will continue, however, there is also a 5% chance that it will not. |
| The third panel from the top of Figure 1 is that of the relative standard error index (RSEI). The RSEI is a statistical measure of volatility. Note that the RSEI is above 0.5, indicating above-average relative volatility. Above-average volatility normally occurs when a trend is ready to reverse. It can also mean that a newly established trend is starting to get ahead of itself. This is the case now. RSEI is now signaling that the newly established uptrend is starting to move upward at too fast a rate of climb and is starting to move too far away from the middle green linear regression trendline. As a result, we could see price correct back down for a few days before continuing its upward climb. Will that correction come immediately? Not necessarily! Price could continue higher for a few more days before the correction sets in. |
| In conclusion, the intermediate-term statistical analysis shows that the Proshares Short SmallCap ETF (SBB) has now reversed its direction from a downward trend to an uptrend. Intermediate-term trends normally last from a few weeks to a few months. As a result, we should expect to see price continue to move higher in the weeks ahead. However, before continuing its trek higher, there is a chance that price could move back down to the green upsloping linear regression trendline before resuming its bullish climb. |
Alan Northam lives in the Dallas, Texas area and as an electronic engineer gave him an analytical mind from which he has developed a thorough knowledge of stock market technical analysis. His abilities to analyze the future direction of the stock market has allowed him to successfully trade of his own portfolio over the last 30 years. Mr. Northam is now retired and trading the stock market full time. You can reach him at inquiry@tradersclassroom.com or by visiting his website at http://www.tradersclassroom.com. You can also follow him on Twitter @TradersClassrm.
| Garland, Tx | |
| Website: | www.tradersclassroom.com |
| E-mail address: | inquiry@tradersclassroom.com |
Click here for more information about our publications!
PRINT THIS ARTICLE

Request Information From Our Sponsors
- StockCharts.com, Inc.
- Candle Patterns
- Candlestick Charting Explained
- Intermarket Technical Analysis
- John Murphy on Chart Analysis
- John Murphy's Chart Pattern Recognition
- John Murphy's Market Message
- MurphyExplainsMarketAnalysis-Intermarket Analysis
- MurphyExplainsMarketAnalysis-Visual Analysis
- StockCharts.com
- Technical Analysis of the Financial Markets
- The Visual Investor
- VectorVest, Inc.
- Executive Premier Workshop
- One-Day Options Course
- OptionsPro
- Retirement Income Workshop
- Sure-Fire Trading Systems (VectorVest, Inc.)
- Trading as a Business Workshop
- VectorVest 7 EOD
- VectorVest 7 RealTime/IntraDay
- VectorVest AutoTester
- VectorVest Educational Services
- VectorVest OnLine
- VectorVest Options Analyzer
- VectorVest ProGraphics v6.0
- VectorVest ProTrader 7
- VectorVest RealTime Derby Tool
- VectorVest Simulator
- VectorVest Variator
- VectorVest Watchdog