HOT TOPICS LIST
- MACD
- Fibonacci
- RSI
- Gann
- ADXR
- Stochastics
- Volume
- Triangles
- Futures
- Cycles
- Volatility
- ZIGZAG
- MESA
- Retracement
- Aroon
INDICATORS LIST
LIST OF TOPICS
PRINT THIS ARTICLE
by Koos van der Merwe
The past six weeks have been truly depressing for the markets.
Position: Buy
Koos van der Merwe
Has been a technical analyst since 1969, and has worked as a futures and options trader with First Financial Futures in Johannesburg, South Africa.
PRINT THIS ARTICLE
HEAD & SHOULDERS
Is Value Vision A Buy?
06/13/11 09:12:16 AMby Koos van der Merwe
The past six weeks have been truly depressing for the markets.
Position: Buy
| My short-term forecast for mid-June into July is positive, but my long-term forecast into 2012 is still a saucer-shaped stagnant market as the politics in the US heats up ahead of a Presidential election. I still believe that this represents a buying opportunity for those stocks you would like to own going into the major bull market from November 2012 to 2016-17. Is Value Vision (VVTV) one of those stocks you would like to own? |

|
| FIGURE 1: VALUE VISION, MONTHLY |
| Graphic provided by: AdvancedGET. |
| |
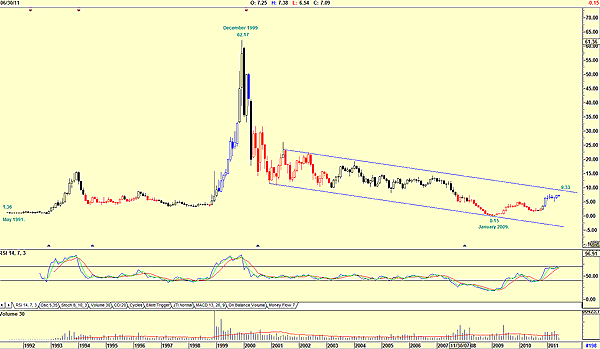
| Figure 1, a monthly chart, shows how the share price rose from $1.36 in May 1991 to a high of $62.17 along with the inflating technology bubble that burst in 2000. The chart suggests that by crashing in January 2000, the share price was ahead of the market collapse, although it did try to recover in February 2000, only to fall with the market to a low of $0.15 by January 2009. Since then, the share has been moving up gradually. Is this a sign that investors are scared of investing with the company? There is resistance at $9.33. And the relative strength index (RSI) is approaching overbought conditions. Volume has also fallen on the recent rise, a sign of weakness. The financials of the company, however, do not look at all good. For the period ended April 30, 2011, the company showed a net loss of $28,930, whereas for January 29, 2011, the net loss was only $1,390. Why are the daily technicals of the company suggesting a buy signal? Investopedia, under the heading "Strong Stocks Worth Stcking To," posted on June 8 Value Vision as a stock for aggressive traders to buy. |

|
| FIGURE 2: VALUE VISION, WEEKLY |
| Graphic provided by: AdvancedGET. |
| |
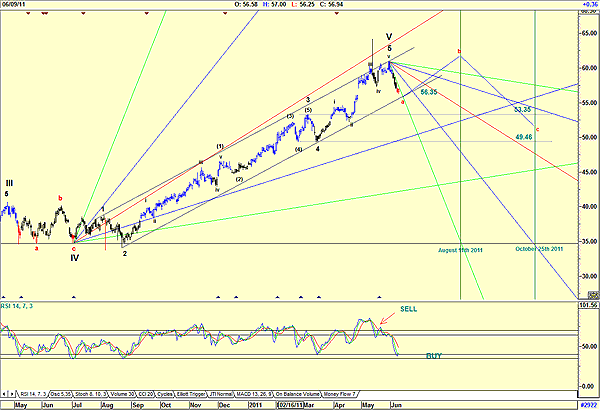
| Figure 2, a daily chart, shows that an inverted head & shoulders formation has formed, and a buy signal was given when the price broke above the neckline at A. The target suggested is $9.01 (7.02 -5.03 = 1.99 + 7.02 = 9.01). Note that the RSI is rising and volume fell as the price fell and rose along with the price rise. Value Vision is definitely a share for traders with a suggested $2.00 profit. Investors, however, should be cautious. With the company showing continued financial losses, it could possibly be a takeover target, the share price will rise dramatically should that happen, or losses could accelerate and the company could say "Goodbye." |
Has been a technical analyst since 1969, and has worked as a futures and options trader with First Financial Futures in Johannesburg, South Africa.
| Address: | 3256 West 24th Ave |
| Vancouver, BC | |
| Phone # for sales: | 6042634214 |
| E-mail address: | petroosp@gmail.com |
Click here for more information about our publications!
PRINT THIS ARTICLE

Request Information From Our Sponsors
- StockCharts.com, Inc.
- Candle Patterns
- Candlestick Charting Explained
- Intermarket Technical Analysis
- John Murphy on Chart Analysis
- John Murphy's Chart Pattern Recognition
- John Murphy's Market Message
- MurphyExplainsMarketAnalysis-Intermarket Analysis
- MurphyExplainsMarketAnalysis-Visual Analysis
- StockCharts.com
- Technical Analysis of the Financial Markets
- The Visual Investor
- VectorVest, Inc.
- Executive Premier Workshop
- One-Day Options Course
- OptionsPro
- Retirement Income Workshop
- Sure-Fire Trading Systems (VectorVest, Inc.)
- Trading as a Business Workshop
- VectorVest 7 EOD
- VectorVest 7 RealTime/IntraDay
- VectorVest AutoTester
- VectorVest Educational Services
- VectorVest OnLine
- VectorVest Options Analyzer
- VectorVest ProGraphics v6.0
- VectorVest ProTrader 7
- VectorVest RealTime Derby Tool
- VectorVest Simulator
- VectorVest Variator
- VectorVest Watchdog
