HOT TOPICS LIST
- MACD
- Fibonacci
- RSI
- Gann
- ADXR
- Stochastics
- Volume
- Triangles
- Futures
- Cycles
- Volatility
- ZIGZAG
- MESA
- Retracement
- Aroon
INDICATORS LIST
LIST OF TOPICS
PRINT THIS ARTICLE
by Koos van der Merwe
With the financial crises hurting our pockets, more and more are staying home watching TV.
Position: Accumulate
Koos van der Merwe
Has been a technical analyst since 1969, and has worked as a futures and options trader with First Financial Futures in Johannesburg, South Africa.
PRINT THIS ARTICLE
ELLIOTT WAVE
Viacom At Home
06/10/11 01:06:06 PMby Koos van der Merwe
With the financial crises hurting our pockets, more and more are staying home watching TV.
Position: Accumulate
| Spending an evening out at the movies enjoying a large screen and an entertaining movie, crunching popcorn, and sipping a Coke. Glad to be out, away from the kids and with friends. Those are the good times, but when times are tough, we sit at home in front of the TV, watching a rented movie, microwaving popcorn at a quarter of the price you pay for it at the cinema. Viacom's (VIA) goal is to be the world's leading branded entertainment company across television, motion pictures, and digital media platforms, and their share price shows that they are doing quiet well, thank you. |

|
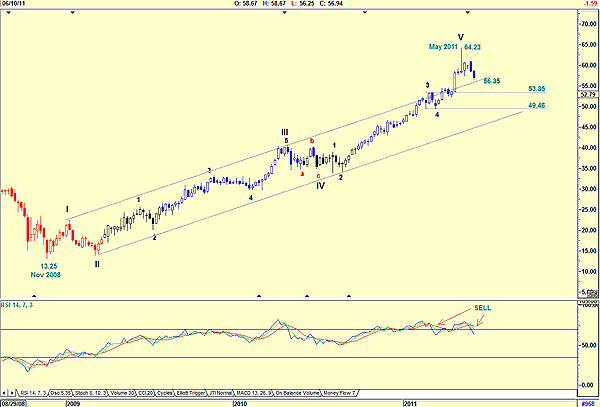
| FIGURE 1: VIACOM, WEEKLY |
| Graphic provided by: AdvancedGET. |
| |
| Figure 1, a weekly chart, shows how the price moved up strongly from a low of $13.25 in November 2008 to a high of $64.23 by May 2011. My Elliott wave count suggests that at this level, a wave 5 has been completed, and that we should now expect an A-B-C correction taking the share to somewhere between $49.46-$53.35, the fourth wave of lesser degree. This correction is confirmed by the relative strength index (RSI), which is at an overbought level, and has given another sell signal. The price did break above the upward trendline when it rose to $64.23, but it has since fallen, possible to find support at the trendline, at approximately the $56.35 level. |

|
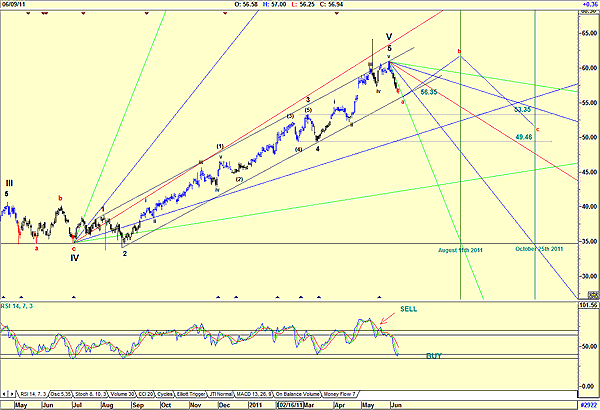
| FIGURE 2: VIACOM WITH GANN FANS, DAILY |
| Graphic provided by: AdvancedGET. |
| |
| Figure 2, a daily chart, shows that the wave count suggested by the weekly chart is correct, and is suggesting that the a-wave correction is possibly complete, with a b-wave up now on the cards. This is confirmed by the RSI, which is oversold, suggesting a buy signal is in the offing. A Gann fan, shown on the chart, is suggesting that wave b could top approximately August 11, and wave c would bottom around about October 25. The chart of Viacom shows how the share price moved up strongly over the past two and a half years. My Elliott wave count, however, is suggesting a strong ABC correction is happening. Short-term traders could profit from the b-wave correction. Long-term investors should wait until the price falls to the c-wave bottom. |
Has been a technical analyst since 1969, and has worked as a futures and options trader with First Financial Futures in Johannesburg, South Africa.
| Address: | 3256 West 24th Ave |
| Vancouver, BC | |
| Phone # for sales: | 6042634214 |
| E-mail address: | petroosp@gmail.com |
Click here for more information about our publications!
PRINT THIS ARTICLE

Request Information From Our Sponsors
- StockCharts.com, Inc.
- Candle Patterns
- Candlestick Charting Explained
- Intermarket Technical Analysis
- John Murphy on Chart Analysis
- John Murphy's Chart Pattern Recognition
- John Murphy's Market Message
- MurphyExplainsMarketAnalysis-Intermarket Analysis
- MurphyExplainsMarketAnalysis-Visual Analysis
- StockCharts.com
- Technical Analysis of the Financial Markets
- The Visual Investor
- VectorVest, Inc.
- Executive Premier Workshop
- One-Day Options Course
- OptionsPro
- Retirement Income Workshop
- Sure-Fire Trading Systems (VectorVest, Inc.)
- Trading as a Business Workshop
- VectorVest 7 EOD
- VectorVest 7 RealTime/IntraDay
- VectorVest AutoTester
- VectorVest Educational Services
- VectorVest OnLine
- VectorVest Options Analyzer
- VectorVest ProGraphics v6.0
- VectorVest ProTrader 7
- VectorVest RealTime Derby Tool
- VectorVest Simulator
- VectorVest Variator
- VectorVest Watchdog
