HOT TOPICS LIST
- MACD
- Fibonacci
- RSI
- Gann
- ADXR
- Stochastics
- Volume
- Triangles
- Futures
- Cycles
- Volatility
- ZIGZAG
- MESA
- Retracement
- Aroon
INDICATORS LIST
LIST OF TOPICS
PRINT THIS ARTICLE
by Mike Carr, CMT
The chart of gasoline shows an example of how downside gaps can offer resistance.
Position: Sell
Mike Carr, CMT
Mike Carr, CMT, is a member of the Market Technicians Association, and editor of the MTA's newsletter, Technically Speaking. He is also the author of "Smarter Investing in Any Economy: The Definitive Guide to Relative Strength Investing," and "Conquering the Divide: How to Use Economic Indicators to Catch Stock Market Trends."
PRINT THIS ARTICLE
STRATEGIES
Gas Hits Resistance
06/10/11 08:07:19 AMby Mike Carr, CMT
The chart of gasoline shows an example of how downside gaps can offer resistance.
Position: Sell
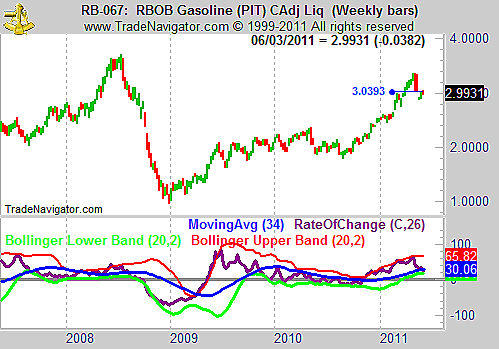
| Unleaded gasoline prices surged almost 70% over 12 months into their May high. Since then, prices have backed off those highs and fallen more than 10% in the past month. Figure 1 shows that we opened on gap down on the week of May 20, and prices failed to rally through that gap over the next few weeks. |

|
| FIGURE 1: RBOB, WEEKLY. Unleaded gas faces significant resistance near the $3.00 price level. |
| Graphic provided by: Trade Navigator. |
| |
| We have several arguments for a bearish scenario in unleaded gas. The rate of change indicator has fallen to its lower Bollinger band, but is still relatively high. Prices have advanced about 30% in the past six months, an unsustainably fast gain. Usually rapid price gains need to be followed by consolidation, or they are reversed. Over any time frame, we can see that unleaded gas has had a bubblelike move, and a reversal would not be unusual. |
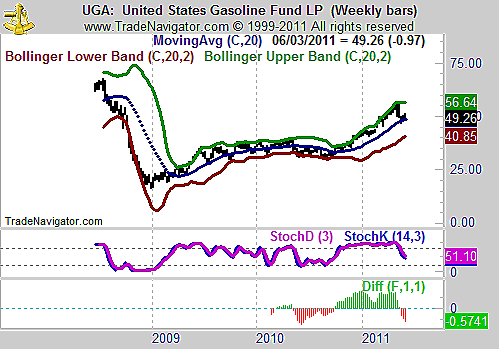
| On a seasonal basis, unleaded gas futures trade lower 52% of the time in June. Stock traders can use an exchange traded fund (ETF), US Gasoline Fund (UGA), to trade unleaded gas prices. Figure 2 shows this ETF with a bearish-looking stochastic and moving average convergence/divergence (MACD) histogram. |

|
| FIGURE 2: UGA, WEEKLY. The weekly chart of UGA shows the same pattern as unleaded gas futures. |
| Graphic provided by: Trade Navigator. |
| |
| Traders can profit from a decline in unleaded gas prices, just as consumers will see a benefit at the gas pump. This could also be good news for the economy, since less spending on gas could mean more consumer spending at retailers. Those unwilling to trade on the short side might want to consider a retail ETF like XRT as an option to invest in lower gas prices. |
Mike Carr, CMT, is a member of the Market Technicians Association, and editor of the MTA's newsletter, Technically Speaking. He is also the author of "Smarter Investing in Any Economy: The Definitive Guide to Relative Strength Investing," and "Conquering the Divide: How to Use Economic Indicators to Catch Stock Market Trends."
| Website: | www.moneynews.com/blogs/MichaelCarr/id-73 |
| E-mail address: | marketstrategist@gmail.com |
Click here for more information about our publications!
PRINT THIS ARTICLE

Request Information From Our Sponsors
- VectorVest, Inc.
- Executive Premier Workshop
- One-Day Options Course
- OptionsPro
- Retirement Income Workshop
- Sure-Fire Trading Systems (VectorVest, Inc.)
- Trading as a Business Workshop
- VectorVest 7 EOD
- VectorVest 7 RealTime/IntraDay
- VectorVest AutoTester
- VectorVest Educational Services
- VectorVest OnLine
- VectorVest Options Analyzer
- VectorVest ProGraphics v6.0
- VectorVest ProTrader 7
- VectorVest RealTime Derby Tool
- VectorVest Simulator
- VectorVest Variator
- VectorVest Watchdog
- StockCharts.com, Inc.
- Candle Patterns
- Candlestick Charting Explained
- Intermarket Technical Analysis
- John Murphy on Chart Analysis
- John Murphy's Chart Pattern Recognition
- John Murphy's Market Message
- MurphyExplainsMarketAnalysis-Intermarket Analysis
- MurphyExplainsMarketAnalysis-Visual Analysis
- StockCharts.com
- Technical Analysis of the Financial Markets
- The Visual Investor
