HOT TOPICS LIST
- MACD
- Fibonacci
- RSI
- Gann
- ADXR
- Stochastics
- Volume
- Triangles
- Futures
- Cycles
- Volatility
- ZIGZAG
- MESA
- Retracement
- Aroon
INDICATORS LIST
LIST OF TOPICS
PRINT THIS ARTICLE
by Donald W. Pendergast, Jr.
Shares of Morgan Stanley may be close to reaching a temporary area of support from which to launch a minor rally.
Position: N/A
Donald W. Pendergast, Jr.
Donald W. Pendergast is a financial markets consultant who offers specialized services to stock brokers and high net worth individuals who seek a better bottom line for their portfolios.
PRINT THIS ARTICLE
OVERBOUGHT OVERSOLD
Is Morgan Stanley Ready For Relief?
06/08/11 07:55:02 AMby Donald W. Pendergast, Jr.
Shares of Morgan Stanley may be close to reaching a temporary area of support from which to launch a minor rally.
Position: N/A
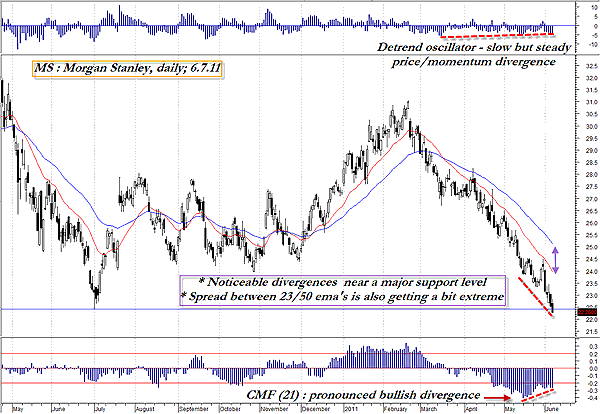
| When the broad market has really sold off hard and is approaching tentative support levels, that can be a good time to run the Deel oversold reversal screen on the Standard & Poor's 500 component stocks in MetaStock 11. This particular exploration seeks to locate the stocks that are oversold to the point that a reversal becomes more likely than not. Running the screen after Tuesday's close revealed that shares of Morgan Stanley (MS) were definitely in the running as far as the stock having gone too far south, too fast during the current savage wave of selling in the market. Here's a closer look at the daily chart for MS (Figure 1). |

|
| FIGURE 1: MORGAN STANLEY, DAILY. Always wait for a bullish reversal bar before ever attempting to cash in on a potential bounce off of support kind of trading setup. Better safe than sorry. |
| Graphic provided by: MetaStock. |
| Graphic provided by: WB Detrend RT EOD from ProfitTrader for MetaStock. |
| |
| Shares of MS have really been clobbered hard since peaking in late February, shedding more than a quarter of their value since then. But with the stock now right near the major support level that was established early last summer (July 2010) and the Deel oversold reversal screen giving traders a heads-up that a tentative bottom and possibly a subsequent bounce may be coming up sooner rather than later. Two more clues that add some extra credence to the exploration's output is the current configuration of the detrend oscillator (top of chart) and the 12-period Chaikin money flow (CMF)(21) histogram (bottom of the chart); both indicators are flashing signs of a potential bullish divergence setup, one that only needs a strong bullish reversal bar for a full confirmation. Always wait for that confirmation before acting on any kind of oversold reversal play, as that's the only safe way to engage such a trade setup. |
| Traders can sell a July $21 MS put for about $0.40 right now; the put is out-of-the-money, giving a cushion against further slides in the share price; that's one potential way to play this setup, although you would be putting on the position before actually getting that all-important bullish reversal bar. So to be safe, if the put sold at $0.40 doubles in price to $0.80, by all means buy it back and wait for a better opportunity to come along. Sharp intraday traders can also put their 15- to 30-minute charts to good use to help confirm a tradable bullish bounce as well, particularly if such a reversal takes hold near the major support level near $22.40 or so. There are many exciting opportunities in all kinds of markets. You just need the skill and self-confidence to act at the opportune time. |
Donald W. Pendergast is a financial markets consultant who offers specialized services to stock brokers and high net worth individuals who seek a better bottom line for their portfolios.
| Title: | Writer, market consultant |
| Company: | Linear Trading Systems LLC |
| Jacksonville, FL 32217 | |
| Phone # for sales: | 904-239-9564 |
| E-mail address: | lineartradingsys@gmail.com |
Traders' Resource Links | |
| Linear Trading Systems LLC has not added any product or service information to TRADERS' RESOURCE. | |
Click here for more information about our publications!
PRINT THIS ARTICLE

Request Information From Our Sponsors
- VectorVest, Inc.
- Executive Premier Workshop
- One-Day Options Course
- OptionsPro
- Retirement Income Workshop
- Sure-Fire Trading Systems (VectorVest, Inc.)
- Trading as a Business Workshop
- VectorVest 7 EOD
- VectorVest 7 RealTime/IntraDay
- VectorVest AutoTester
- VectorVest Educational Services
- VectorVest OnLine
- VectorVest Options Analyzer
- VectorVest ProGraphics v6.0
- VectorVest ProTrader 7
- VectorVest RealTime Derby Tool
- VectorVest Simulator
- VectorVest Variator
- VectorVest Watchdog
- StockCharts.com, Inc.
- Candle Patterns
- Candlestick Charting Explained
- Intermarket Technical Analysis
- John Murphy on Chart Analysis
- John Murphy's Chart Pattern Recognition
- John Murphy's Market Message
- MurphyExplainsMarketAnalysis-Intermarket Analysis
- MurphyExplainsMarketAnalysis-Visual Analysis
- StockCharts.com
- Technical Analysis of the Financial Markets
- The Visual Investor
