HOT TOPICS LIST
- MACD
- Fibonacci
- RSI
- Gann
- ADXR
- Stochastics
- Volume
- Triangles
- Futures
- Cycles
- Volatility
- ZIGZAG
- MESA
- Retracement
- Aroon
INDICATORS LIST
LIST OF TOPICS
PRINT THIS ARTICLE
by Mike Carr, CMT
Stock market indexes have fallen five weeks in a row. Backtesting can show if that is bullish or bearish.
Position: Sell
Mike Carr, CMT
Mike Carr, CMT, is a member of the Market Technicians Association, and editor of the MTA's newsletter, Technically Speaking. He is also the author of "Smarter Investing in Any Economy: The Definitive Guide to Relative Strength Investing," and "Conquering the Divide: How to Use Economic Indicators to Catch Stock Market Trends."
PRINT THIS ARTICLE
STRATEGIES
Down Five Weeks In A Row -- What's Next?
06/07/11 08:21:24 AMby Mike Carr, CMT
Stock market indexes have fallen five weeks in a row. Backtesting can show if that is bullish or bearish.
Position: Sell
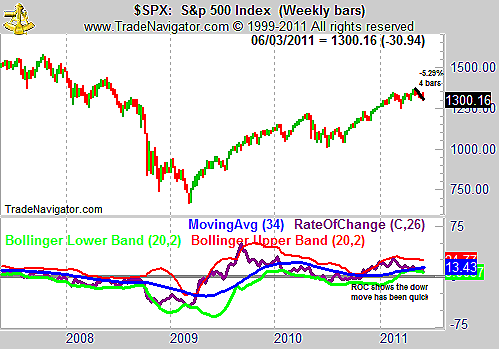
| In the long term, stocks are expected to provide positive returns to investors. That's probably why extended downtrends get headlines. Many news stories over the weekend highlight the fact major indexes have closed lower for five weeks in a row. To traders, that may sound like an oversold market. However, the Standard & Poor's 500 (Figure 1) is only about 5% below its recent highs, a loss more in line with normal volatility than deeply oversold conditions. |

|
| FIGURE 1: SPX, WEEKLY. Prices havenít fallen much, but ROC shows the market may be oversold. |
| Graphic provided by: Trade Navigator. |
| |
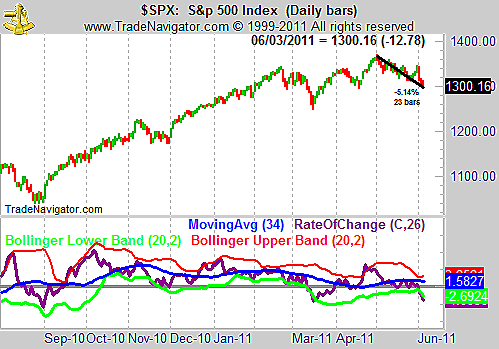
| We see in that chart that rate of change (ROC) is at the lower Bollinger band, a condition usually associated with a bounce higher for price, or at least a consolidation. The daily chart (Figure 2) confirms that stocks have become oversold. |

|
| FIGURE 2: SPX, DAILY. The oversold extreme in ROC is even more visible in the daily chart of the S&P 500. |
| Graphic provided by: Trade Navigator. |
| |
| What about that idea that we're now down five weeks in a row? Testing shows that is actually a short-term negative for the markets. The S&P 500 closes up more than 55% of the time on a weekly basis, and it is up less than 50% of the time in the week after it falls five times in a row. While the week after that is better (up 62% of the time), we are up less than half the time a month later. |
| Technical analysis involves drawing conclusions from multiple data points. In this case, we can conclude that we're likely to see stocks consolidate over the next month. |
Mike Carr, CMT, is a member of the Market Technicians Association, and editor of the MTA's newsletter, Technically Speaking. He is also the author of "Smarter Investing in Any Economy: The Definitive Guide to Relative Strength Investing," and "Conquering the Divide: How to Use Economic Indicators to Catch Stock Market Trends."
| Website: | www.moneynews.com/blogs/MichaelCarr/id-73 |
| E-mail address: | marketstrategist@gmail.com |
Click here for more information about our publications!
PRINT THIS ARTICLE

Request Information From Our Sponsors
- StockCharts.com, Inc.
- Candle Patterns
- Candlestick Charting Explained
- Intermarket Technical Analysis
- John Murphy on Chart Analysis
- John Murphy's Chart Pattern Recognition
- John Murphy's Market Message
- MurphyExplainsMarketAnalysis-Intermarket Analysis
- MurphyExplainsMarketAnalysis-Visual Analysis
- StockCharts.com
- Technical Analysis of the Financial Markets
- The Visual Investor
- VectorVest, Inc.
- Executive Premier Workshop
- One-Day Options Course
- OptionsPro
- Retirement Income Workshop
- Sure-Fire Trading Systems (VectorVest, Inc.)
- Trading as a Business Workshop
- VectorVest 7 EOD
- VectorVest 7 RealTime/IntraDay
- VectorVest AutoTester
- VectorVest Educational Services
- VectorVest OnLine
- VectorVest Options Analyzer
- VectorVest ProGraphics v6.0
- VectorVest ProTrader 7
- VectorVest RealTime Derby Tool
- VectorVest Simulator
- VectorVest Variator
- VectorVest Watchdog
