HOT TOPICS LIST
- MACD
- Fibonacci
- RSI
- Gann
- ADXR
- Stochastics
- Volume
- Triangles
- Futures
- Cycles
- Volatility
- ZIGZAG
- MESA
- Retracement
- Aroon
INDICATORS LIST
LIST OF TOPICS
PRINT THIS ARTICLE
by Koos van der Merwe
A consolidation triangle in the making?
Position: Accumulate
Koos van der Merwe
Has been a technical analyst since 1969, and has worked as a futures and options trader with First Financial Futures in Johannesburg, South Africa.
PRINT THIS ARTICLE
TRIANGLES
Westmoreland Coal Breakout Soon?
06/06/11 08:18:21 AMby Koos van der Merwe
A consolidation triangle in the making?
Position: Accumulate
| Triangles have occasionally been known to reverse a trend, but usually they act as a period of consolidation with prices continuing in the same direction they entered the triangle. Triangles form as a result of indecision by both buyers and sellers. During this period, market participants usually withdraw to the sidelines causing less market participation and falling volume. Then news hits the market, and the breakout is accompanied by a sharp increase in volume. Westmoreland Coal's (WLB) share price is currently forming a symmetrical triangle and will break out as soon as the smallest piece of good news hits the market. Why coal? Well, with nuclear power out of favor after the Japan tsunami, and with oil prices going astronomical, cheap sources of energy are once again looking attractive. Let's face it -- coal is the cheapest source of energy next to natural gas. |

|
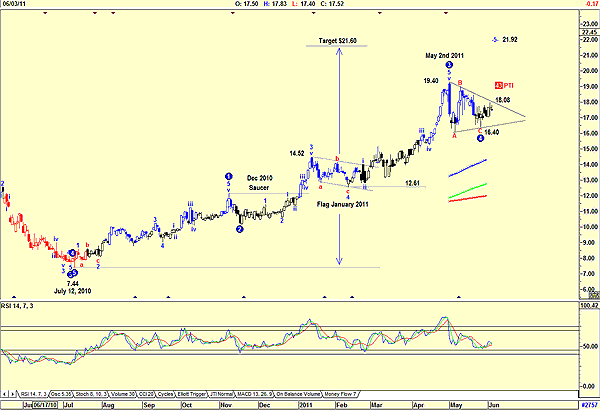
| FIGURE 1: WESTMORELAND COAL, DAILY |
| Graphic provided by: AdvancedGET. |
| |
| Figure 1 shows how the share price of Westmoreland Coal moved from a low of $7.44 on July 12, 2010, to a high of 19.40 by May 2, 2011. On its way up, it formed a saucer pattern in December 2010 and a flag pattern in January 2011. The flag pattern gave a target of $21.60 (14.52 - 7.44 = 7.08 + 14.52 = 21.60). As the chart shows, the share price did not reach the target of $21.60, but $19.40 before forming the consolidation triangle. This triangle is suggesting a target of $23.19 (19.40 -12.61 = 6.79 + 16.40 = 23.19) a price pretty close to the target set by the earlier flag pattern. The program I use, Advanced GET, shows an Elliott wave count suggesting that the consolidation triangle is a fourth-wave correction with a fifth-wave target of $21.92, and a PTI (probability index) of 43%. Finally, do note that the relative strength index (RSI) is at oversold levels, or close to it. I would be a buyer of Westmoreland Coal only when it breaks out above $18.08, the upper resistance line of the triangle. Time will drop this price. |
Has been a technical analyst since 1969, and has worked as a futures and options trader with First Financial Futures in Johannesburg, South Africa.
| Address: | 3256 West 24th Ave |
| Vancouver, BC | |
| Phone # for sales: | 6042634214 |
| E-mail address: | petroosp@gmail.com |
Click here for more information about our publications!
PRINT THIS ARTICLE

Request Information From Our Sponsors
- StockCharts.com, Inc.
- Candle Patterns
- Candlestick Charting Explained
- Intermarket Technical Analysis
- John Murphy on Chart Analysis
- John Murphy's Chart Pattern Recognition
- John Murphy's Market Message
- MurphyExplainsMarketAnalysis-Intermarket Analysis
- MurphyExplainsMarketAnalysis-Visual Analysis
- StockCharts.com
- Technical Analysis of the Financial Markets
- The Visual Investor
- VectorVest, Inc.
- Executive Premier Workshop
- One-Day Options Course
- OptionsPro
- Retirement Income Workshop
- Sure-Fire Trading Systems (VectorVest, Inc.)
- Trading as a Business Workshop
- VectorVest 7 EOD
- VectorVest 7 RealTime/IntraDay
- VectorVest AutoTester
- VectorVest Educational Services
- VectorVest OnLine
- VectorVest Options Analyzer
- VectorVest ProGraphics v6.0
- VectorVest ProTrader 7
- VectorVest RealTime Derby Tool
- VectorVest Simulator
- VectorVest Variator
- VectorVest Watchdog
