HOT TOPICS LIST
- MACD
- Fibonacci
- RSI
- Gann
- ADXR
- Stochastics
- Volume
- Triangles
- Futures
- Cycles
- Volatility
- ZIGZAG
- MESA
- Retracement
- Aroon
INDICATORS LIST
LIST OF TOPICS
PRINT THIS ARTICLE
by Mike Carr, CMT
Traders know that nothing works 100% of the time, but market context can help avoid bad signals.
Position: Sell
Mike Carr, CMT
Mike Carr, CMT, is a member of the Market Technicians Association, and editor of the MTA's newsletter, Technically Speaking. He is also the author of "Smarter Investing in Any Economy: The Definitive Guide to Relative Strength Investing," and "Conquering the Divide: How to Use Economic Indicators to Catch Stock Market Trends."
PRINT THIS ARTICLE
RATE OF CHANGE
Divergences Don't Always Work
06/03/11 09:28:34 AMby Mike Carr, CMT
Traders know that nothing works 100% of the time, but market context can help avoid bad signals.
Position: Sell
| Divergences occur when an indicator and price move in opposite directions. Many technical analysts expect divergences to resolve in the direction of the indicator. This belief is most likely rooted in the fact that indicators are usually momentum based and popular market lore is that momentum leads price. |
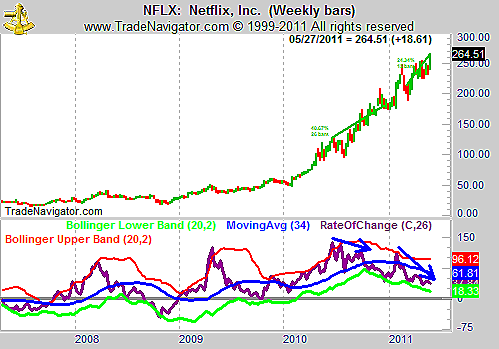
| Netflix (NFLX) has been a market leader this year, up more than 50% through the end of May. In Figure 1, we see two clear momentum divergences that would have warned traders against owning this high-flyer. Rate of change is shown, but most other indicators look about the same. |

|
| FIGURE 1: NFLX, WEEKLY. Momentum divergences accompanied the price increase in NFLX. |
| Graphic provided by: Trade Navigator. |
| |
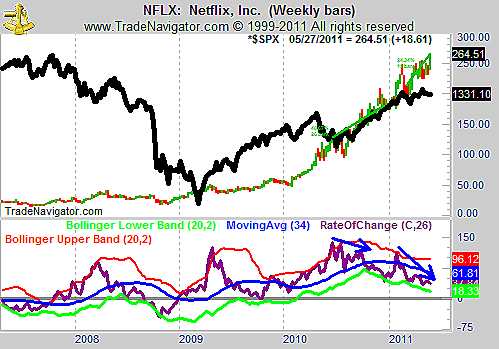
| The first momentum divergence was accompanied by a 40% increase in price, the second by a gain of almost 25%. In Figure 2, we add the Standard & Poor's 500 to the price chart, shown as a solid black line. This shows that momentum in NFLX moved lower as the general market also moved lower, and momentum in NFLX confirmed the overall market trend. |

|
| FIGURE 2: NFLX, WEEKLY. We can see in this chart that both divergences came as the general market declined. |
| Graphic provided by: Trade Navigator. |
| |
| Divergences are a useful tool but cannot be blindly followed. Traders should look at the overall market context to determine if the divergence is meaningful. Lower momentum in an up market would be more likely to deliver profits than the same scenario in a down market. |
Mike Carr, CMT, is a member of the Market Technicians Association, and editor of the MTA's newsletter, Technically Speaking. He is also the author of "Smarter Investing in Any Economy: The Definitive Guide to Relative Strength Investing," and "Conquering the Divide: How to Use Economic Indicators to Catch Stock Market Trends."
| Website: | www.moneynews.com/blogs/MichaelCarr/id-73 |
| E-mail address: | marketstrategist@gmail.com |
Click here for more information about our publications!
PRINT THIS ARTICLE

Request Information From Our Sponsors
- StockCharts.com, Inc.
- Candle Patterns
- Candlestick Charting Explained
- Intermarket Technical Analysis
- John Murphy on Chart Analysis
- John Murphy's Chart Pattern Recognition
- John Murphy's Market Message
- MurphyExplainsMarketAnalysis-Intermarket Analysis
- MurphyExplainsMarketAnalysis-Visual Analysis
- StockCharts.com
- Technical Analysis of the Financial Markets
- The Visual Investor
- VectorVest, Inc.
- Executive Premier Workshop
- One-Day Options Course
- OptionsPro
- Retirement Income Workshop
- Sure-Fire Trading Systems (VectorVest, Inc.)
- Trading as a Business Workshop
- VectorVest 7 EOD
- VectorVest 7 RealTime/IntraDay
- VectorVest AutoTester
- VectorVest Educational Services
- VectorVest OnLine
- VectorVest Options Analyzer
- VectorVest ProGraphics v6.0
- VectorVest ProTrader 7
- VectorVest RealTime Derby Tool
- VectorVest Simulator
- VectorVest Variator
- VectorVest Watchdog
