

HOT TOPICS LIST
- MACD
- Fibonacci
- RSI
- Gann
- ADXR
- Stochastics
- Volume
- Triangles
- Futures
- Cycles
- Volatility
- ZIGZAG
- MESA
- Retracement
- Aroon
INDICATORS LIST
LIST OF TOPICS
PRINT THIS ARTICLE
by Chaitali Mohile
The French CAC Index is stuck between support and resistance.
Position: N/A
Chaitali Mohile
Active trader in the Indian stock markets since 2003 and a full-time writer. Trading is largely based upon technical analysis.
PRINT THIS ARTICLE
SUPPORT & RESISTANCE
$CAC In Narrow Range
06/06/11 12:26:28 PMby Chaitali Mohile
The French CAC Index is stuck between support and resistance.
Position: N/A
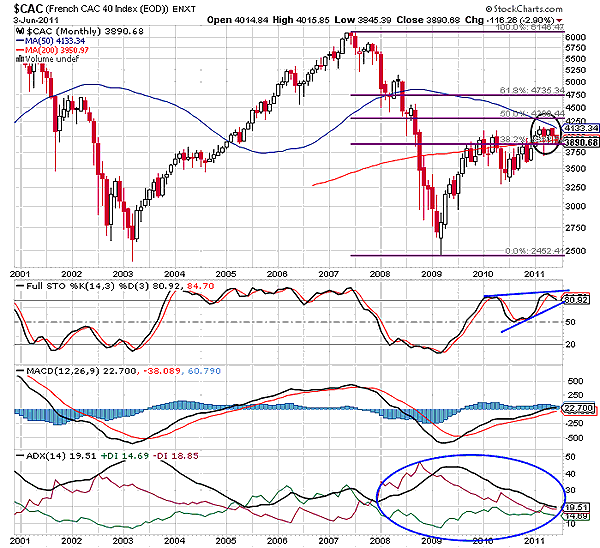
| The pullback rally of French CAC 40 Index ($CAC) breached the major 200-day moving average (MA) resistance at 3800 levels. It was a tough task for $CAC to sustain above this newly formed support. In Figure 1, we can see the index is fluctuating near the ascending 200-day MA resistance, trying to establish support there. The descending 50-day moving average (MA) was another major resistance for the index. After converting the long-term MA resistance to support, the 50-day MA began suppressing a breakout rally. As a result, $CAC turned sideways with the support of the 200-day MA. The Fibonacci retracement level tool used in Figure 1 shows additional support-resistance for the index. The index has violated the first Fibonacci retracement level at 38.2% and is heading towards the next one at the 50% level. However, the 50-day MA resistance has trapped the price rally in a very narrow range. |
|
| FIGURE 1: $CAC, MONTHLY |
| Graphic provided by: StockCharts.com. |
| |
| For the past four months, $CAC ranged between 3880 and 4100. Although the selling pressure is ruling over the buying pressure, an overheated downtrend in Figure 1 has marginally descended below the 20 levels. There is a very small gap between the negative directional index (-DI) (selling pressure) and the positive directional index (+DI) (buying pressure) of the average directional index (ADX) (14), highlighting a volatile consolidation. The moving average convergence/divergence (MACD) (12,26,9) shows diminishing momentum in the rally, which would result in a weak consolidation. The full stochastic (14,3,3) is highly overbought and is likely to plunge. Thus, the indicators and price chart suggest narrow range consolidation for $CAC. |
|
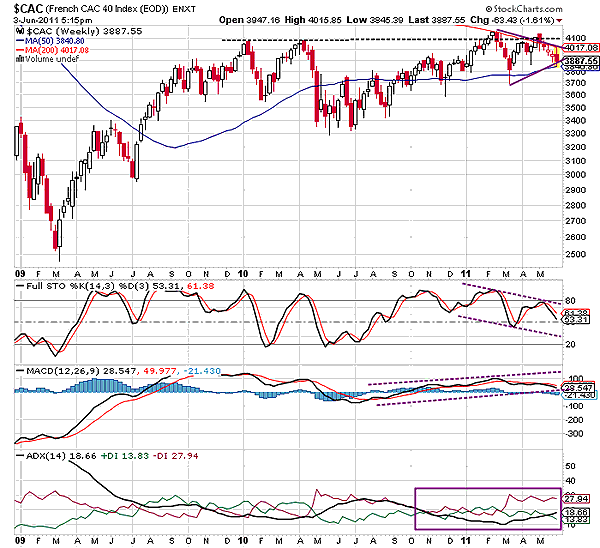
| FIGURE 2: $CAC, WEEKLY |
| Graphic provided by: StockCharts.com. |
| |
| On the weekly time frame in Figure 2, $CAC has a robust previous resistance at 4100. After an advance rally from 3400 levels, the index moved sideways at 4100 levels, forming lower highs and higher lows. We can see the converging consolidation range that looks like a pennant of a bullish flag & pennant formation in Figure 2. The two trendlines of the pennant have almost converged, indicating readiness to break out in an upward direction. But the resistance on the price chart and the bearish pressure would stop the index from undergoing the bullish breakout. The narrowing range of $CAC is filled with red bearish candles and doji candlesticks as well. In addition, the bullish rally (flag pole) also has many long red candles, indicating a strong bearish force throughout the rally. |
| The 200-day and 50-day MAs have trapped the index (Figure 2). The converging moving averages are restricting the consolidating movement of $CAC. We can see the 200-day MA resistance is discouraging every bullish move, whereas the 50-day support is protecting the index from bearish damage. The stochastic oscillator has formed lower lows and highs, forming a descending channel that itself is a bearish formation. The MACD line and trigger line are tangled, indicating high volatility and weak momentum. The ADX (14) is surging above 17 with increasing -DI, signifying the possibility of $CAC regaining its bearish trend. |
| Thus, $CAC would continue its volatile consolidation in the very narrow range of the converging moving averages and other resistances as well. |
Active trader in the Indian stock markets since 2003 and a full-time writer. Trading is largely based upon technical analysis.
| Company: | Independent |
| Address: | C1/3 Parth Indraprasth Towers. Vastrapur |
| Ahmedabad, Guj 380015 | |
| E-mail address: | chaitalimohile@yahoo.co.in |
Traders' Resource Links | |
| Independent has not added any product or service information to TRADERS' RESOURCE. | |
Click here for more information about our publications!
PRINT THIS ARTICLE

Request Information From Our Sponsors
- StockCharts.com, Inc.
- Candle Patterns
- Candlestick Charting Explained
- Intermarket Technical Analysis
- John Murphy on Chart Analysis
- John Murphy's Chart Pattern Recognition
- John Murphy's Market Message
- MurphyExplainsMarketAnalysis-Intermarket Analysis
- MurphyExplainsMarketAnalysis-Visual Analysis
- StockCharts.com
- Technical Analysis of the Financial Markets
- The Visual Investor
- VectorVest, Inc.
- Executive Premier Workshop
- One-Day Options Course
- OptionsPro
- Retirement Income Workshop
- Sure-Fire Trading Systems (VectorVest, Inc.)
- Trading as a Business Workshop
- VectorVest 7 EOD
- VectorVest 7 RealTime/IntraDay
- VectorVest AutoTester
- VectorVest Educational Services
- VectorVest OnLine
- VectorVest Options Analyzer
- VectorVest ProGraphics v6.0
- VectorVest ProTrader 7
- VectorVest RealTime Derby Tool
- VectorVest Simulator
- VectorVest Variator
- VectorVest Watchdog