HOT TOPICS LIST
- MACD
- Fibonacci
- RSI
- Gann
- ADXR
- Stochastics
- Volume
- Triangles
- Futures
- Cycles
- Volatility
- ZIGZAG
- MESA
- Retracement
- Aroon
INDICATORS LIST
LIST OF TOPICS
PRINT THIS ARTICLE
by Donald W. Pendergast, Jr.
A variety of indicators and systems are all in agreement that lower prices are very likely for shares of Archer Daniels Midland in the days and weeks ahead.
Position: Sell
Donald W. Pendergast, Jr.
Donald W. Pendergast is a financial markets consultant who offers specialized services to stock brokers and high net worth individuals who seek a better bottom line for their portfolios.
PRINT THIS ARTICLE
SUPPORT & RESISTANCE
ADM Just Above A Critical Support Zone
06/03/11 08:50:25 AMby Donald W. Pendergast, Jr.
A variety of indicators and systems are all in agreement that lower prices are very likely for shares of Archer Daniels Midland in the days and weeks ahead.
Position: Sell
| For such a large-cap stock, Archer Daniels Midland (ADM) tends to make some very nice trend moves every so often -- moves that the average retail trader and investor can put to good use, as that's when you can make the most amount of money in a minimum amount of time -- that is, when a tradable trend move begins to take root. ADM has had a modest drop in recent weeks, and now that it lies just above a major support level, traders and investors need to be watching this stock in anticipation of further significant moves lower -- especially if the broad market goes into corrective mode. |

|
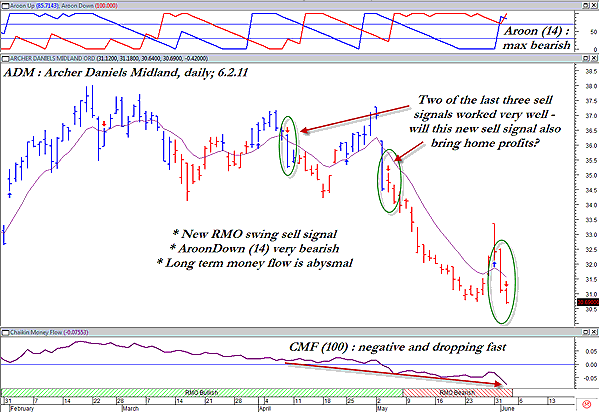
| FIGURE 1: ADM, DAILY. This isn't a pretty picture for the buy-and-hold crowd in ADM shares. For aggressive short sellers or put option buyers, however, it could be the sound of the cash register ringing. |
| Graphic provided by: MetaStock. |
| Graphic provided by: Rahul Mohindar RMO indicators from Metastock v.11. |
| |
| This particular MetaStock chart template features a 14-period Aroon indicator, a 100-period Chaikin money flow indicator, all recent Rahul Mohindar oscillator (RMO) swing buy/sell signals and the RMO expert advisor ribbon (bottom of the chart). A nine-period exponential moving average (EMA) is also used to give an idea of short-term trend strength. Overall, this chart displays a very bearish bias, and it's not too hard to envision ADM shares tanking below $30, possibly challenging the major November 2010 low of $28.53 within the next week or so. ADM shares also feature an extremely weak comparative relative strength ranking against the .SPX, offering even more reasons for aggressive traders to continue shorting the stock -- especially in the wake of the new RMO swing sell signal. |

|
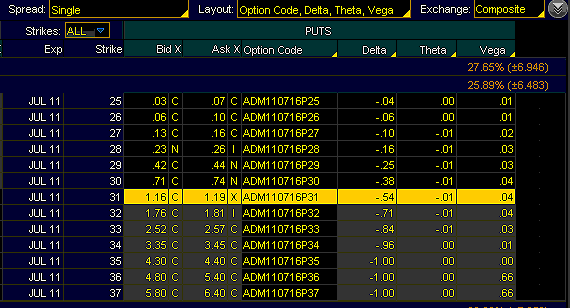
| FIGURE 2: PUTS. The July 2011 ADM $31 put is slightly in-the-money, has a modest time decay factor ($1 per day), and also has a nice, close bid-ask spread. |
| Graphic provided by: Thinkorswim. |
| |
| Going short a stock isn't all that complicated a deal (you borrow the shares from your broker and then sell them into the market, hoping to buy them back at a lower prices -- for a profit), but there are several risks to be aware of: * Dividend repayment risk * Short-squeeze reversal risk * The natural, long-term upward bias of most stock indexes does not make shorting a very profitable pastime -- in general terms, but there are always exceptions. If you short ADM shares, you may want to run a very close two-bar trailing stop of the daily highs as your get-out point. On a major drop, you may do pretty well with such a trailing-stop arrangement and yet still have the comfort of knowing the stop is fairly close, just in case. Buying a July $31 put option might actually be a better deal for conservative traders, as your risk is simply the cost of the option, and you won't get too hurt, even if a short-covering rally suddenly erupts. The put is selling for about $1.19 and should do very nicely on a fast plunge toward that aforementioned support level at $28.53, which, by the way, is a good profit target point for a long put play for this particular chart setup. You pay your money and buy the put option, or you short the shares and hope for a continued plunge, no matter which route you choose. It's nice when you have multiple ways to play a stock, and this looks to be a reasonably low-risk short setup in shares of ADM. Do some research on your own and see if you agree. |
Donald W. Pendergast is a financial markets consultant who offers specialized services to stock brokers and high net worth individuals who seek a better bottom line for their portfolios.
| Title: | Writer, market consultant |
| Company: | Linear Trading Systems LLC |
| Jacksonville, FL 32217 | |
| Phone # for sales: | 904-239-9564 |
| E-mail address: | lineartradingsys@gmail.com |
Traders' Resource Links | |
| Linear Trading Systems LLC has not added any product or service information to TRADERS' RESOURCE. | |
Click here for more information about our publications!
PRINT THIS ARTICLE

Request Information From Our Sponsors
- StockCharts.com, Inc.
- Candle Patterns
- Candlestick Charting Explained
- Intermarket Technical Analysis
- John Murphy on Chart Analysis
- John Murphy's Chart Pattern Recognition
- John Murphy's Market Message
- MurphyExplainsMarketAnalysis-Intermarket Analysis
- MurphyExplainsMarketAnalysis-Visual Analysis
- StockCharts.com
- Technical Analysis of the Financial Markets
- The Visual Investor
- VectorVest, Inc.
- Executive Premier Workshop
- One-Day Options Course
- OptionsPro
- Retirement Income Workshop
- Sure-Fire Trading Systems (VectorVest, Inc.)
- Trading as a Business Workshop
- VectorVest 7 EOD
- VectorVest 7 RealTime/IntraDay
- VectorVest AutoTester
- VectorVest Educational Services
- VectorVest OnLine
- VectorVest Options Analyzer
- VectorVest ProGraphics v6.0
- VectorVest ProTrader 7
- VectorVest RealTime Derby Tool
- VectorVest Simulator
- VectorVest Variator
- VectorVest Watchdog
