HOT TOPICS LIST
- MACD
- Fibonacci
- RSI
- Gann
- ADXR
- Stochastics
- Volume
- Triangles
- Futures
- Cycles
- Volatility
- ZIGZAG
- MESA
- Retracement
- Aroon
INDICATORS LIST
LIST OF TOPICS
PRINT THIS ARTICLE
by Mike Carr, CMT
Traders fear September and October, months known for crashes, but June should also be feared.
Position: Sell
Mike Carr, CMT
Mike Carr, CMT, is a member of the Market Technicians Association, and editor of the MTA's newsletter, Technically Speaking. He is also the author of "Smarter Investing in Any Economy: The Definitive Guide to Relative Strength Investing," and "Conquering the Divide: How to Use Economic Indicators to Catch Stock Market Trends."
PRINT THIS ARTICLE
SEASONAL TRADING
June Is A Bad Month For Stocks
06/03/11 08:39:48 AMby Mike Carr, CMT
Traders fear September and October, months known for crashes, but June should also be feared.
Position: Sell
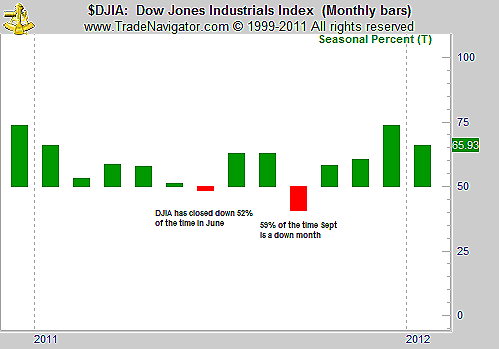
| Stock market crashes in the autumn are legendary. The historic decline of 1929 was in October, as was the 1987 plunge. These events are most likely overweighted in the minds of investors, since the long-term record shows June is actually a more bearish month. Looking at a chart of the Dow Jones Industrial Average (DJIA) (Figure 1) shows that June and September are the only months that closed lower more often than they closed up. September is the more bearish of the two months, but June has been down in 47 of the past 90 years. |
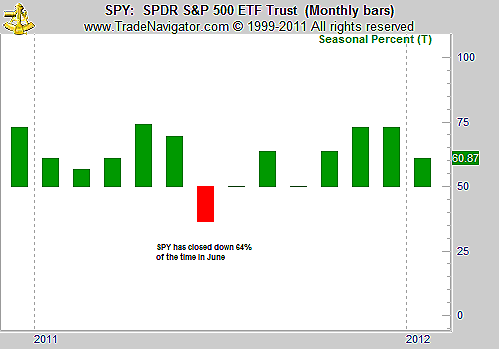
| Looking at more recent history, only June has been a down month for SPY, an exchange traded fund (ETF) that tracks the Standard & Poor's 500 (see Figure 2). June has been down almost two-thirds of the time, showing a stronger bearish tendency than any month for the DJIA. |

|
| FIGURE 1: DJIA, MONTHLY. June is a historically weak month for the Dow Jones Industrial Average. |
| Graphic provided by: Trade Navigator. |
| |
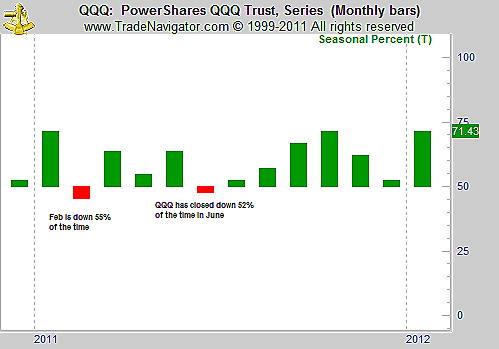
| June has also been a down month for the NASDAQ 100, at least as measured by the performance of the QQQ ETF (see Figure 3). February is more bearish, but we definitely see weakness in June for this index as well. |

|
| FIGURE 2: SPY, MONTHLY. June is also a bearish month for the S&P 500. |
| Graphic provided by: Trade Navigator. |
| |
| Data shows that June deserves the bearish reputation of September and October for stock market investors. With history as a guide, this month may not be any kinder than May has been to stock market investors. |

|
| FIGURE 3: DJIA, MONTHLY. Again, we see a bearish pattern for June. |
| Graphic provided by: Trade Navigator. |
| |
Mike Carr, CMT, is a member of the Market Technicians Association, and editor of the MTA's newsletter, Technically Speaking. He is also the author of "Smarter Investing in Any Economy: The Definitive Guide to Relative Strength Investing," and "Conquering the Divide: How to Use Economic Indicators to Catch Stock Market Trends."
| Website: | www.moneynews.com/blogs/MichaelCarr/id-73 |
| E-mail address: | marketstrategist@gmail.com |
Click here for more information about our publications!
PRINT THIS ARTICLE

Request Information From Our Sponsors
- VectorVest, Inc.
- Executive Premier Workshop
- One-Day Options Course
- OptionsPro
- Retirement Income Workshop
- Sure-Fire Trading Systems (VectorVest, Inc.)
- Trading as a Business Workshop
- VectorVest 7 EOD
- VectorVest 7 RealTime/IntraDay
- VectorVest AutoTester
- VectorVest Educational Services
- VectorVest OnLine
- VectorVest Options Analyzer
- VectorVest ProGraphics v6.0
- VectorVest ProTrader 7
- VectorVest RealTime Derby Tool
- VectorVest Simulator
- VectorVest Variator
- VectorVest Watchdog
- StockCharts.com, Inc.
- Candle Patterns
- Candlestick Charting Explained
- Intermarket Technical Analysis
- John Murphy on Chart Analysis
- John Murphy's Chart Pattern Recognition
- John Murphy's Market Message
- MurphyExplainsMarketAnalysis-Intermarket Analysis
- MurphyExplainsMarketAnalysis-Visual Analysis
- StockCharts.com
- Technical Analysis of the Financial Markets
- The Visual Investor
