HOT TOPICS LIST
- MACD
- Fibonacci
- RSI
- Gann
- ADXR
- Stochastics
- Volume
- Triangles
- Futures
- Cycles
- Volatility
- ZIGZAG
- MESA
- Retracement
- Aroon
INDICATORS LIST
LIST OF TOPICS
PRINT THIS ARTICLE
by Chaitali Mohile
The Russell 2000 Small Cap Index has reached its historical peak. What's next?
Position: N/A
Chaitali Mohile
Active trader in the Indian stock markets since 2003 and a full-time writer. Trading is largely based upon technical analysis.
PRINT THIS ARTICLE
SUPPORT & RESISTANCE
$RUT At Make-Or-Break Level
06/03/11 12:20:53 PMby Chaitali Mohile
The Russell 2000 Small Cap Index has reached its historical peak. What's next?
Position: N/A
| The years 2007-08 saw a serious turbulence in the financial markets across the world. All the major indexes nose-dived to their historical lows. The flames of recessions were felt by every one. However, the situation turned favorable as the market began showing signs of recovery. |
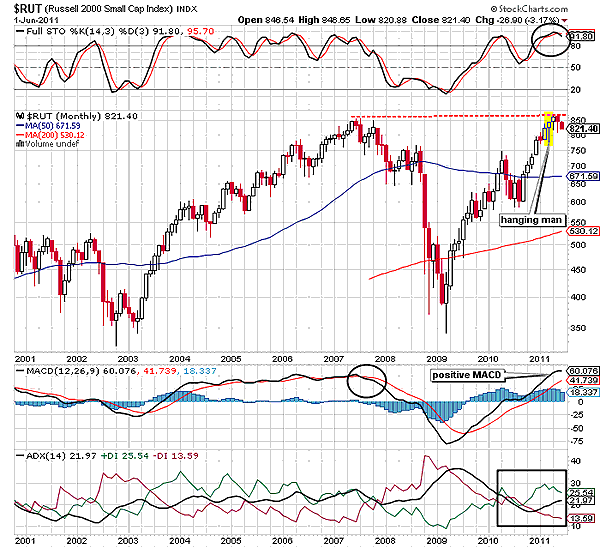
| The Russell 2000 Small Cap Index ($RUT) was at its all-time high of 850 levels in 2007. The bearish correction brought the index to as low as 340 levels. The monthly chart in Figure 1 shows the detailed picture of the index. The initial support of the 50-day moving average (MA) breached, developing a fresh downtrend. The moving average convergence/divergence (MACD) (12,26,9) slipped into negative territory, indicating bearish momentum in the rally. $RUT like all other indexes was engulfed with the dark bearish clouds till the rally established support at the lowest point of the series. |

|
| FIGURE 1: $RUT, MONTHLY. The three hanging man candlestick patterns are signifying the possibility of a bearish breakdown of $RUT. |
| Graphic provided by: StockCharts.com. |
| |
| Eventually, $RUT began to pullback and recovered from its previous losses. It took two and half years for the index to reach its prior high. The 50-day and 200-day moving average (MA) resistances have been converted to supports. Currently, $RUT has hit a major resistance at 850 levels. We need to wait patiently to get the confirmed breakout signals. At the 850 levels, strong bearish pressure is likely to flood the index. In Figure 1, we can see a 'three hanging man' candlestick pattern. The two candles in the yellow block are white and the third candle is a completely bearish hanging man, showing declining bullish hold and increasing bearish strength. |
| The hanging man candlestick pattern is a bearish reversal formation that begins a fresh downtrend. In Figure 1 there are three hanging man candlesticks reflecting strong bearish pressure at 850 levels. The full stochastic (14,3,3) is highly overbought, signifying the possibility of a reversal. However, the MACD (12,26,9) and ADX (14) are bullish. The uptrend is developing, and the selling pressure (negative directional index -DI) is not ready to surge. Therefore, the indicators are flashing mixed views in Figure 1. In such a scenario, $RUT could witness highly volatile consolidation at 850 levels before actually breaking down. |
| Considering the current corrective phase of the financial market and the technical chart of $RUT, the index is likely to tumble a few points from the 850 resistance. |
Active trader in the Indian stock markets since 2003 and a full-time writer. Trading is largely based upon technical analysis.
| Company: | Independent |
| Address: | C1/3 Parth Indraprasth Towers. Vastrapur |
| Ahmedabad, Guj 380015 | |
| E-mail address: | chaitalimohile@yahoo.co.in |
Traders' Resource Links | |
| Independent has not added any product or service information to TRADERS' RESOURCE. | |
Click here for more information about our publications!
PRINT THIS ARTICLE

Request Information From Our Sponsors
- StockCharts.com, Inc.
- Candle Patterns
- Candlestick Charting Explained
- Intermarket Technical Analysis
- John Murphy on Chart Analysis
- John Murphy's Chart Pattern Recognition
- John Murphy's Market Message
- MurphyExplainsMarketAnalysis-Intermarket Analysis
- MurphyExplainsMarketAnalysis-Visual Analysis
- StockCharts.com
- Technical Analysis of the Financial Markets
- The Visual Investor
- VectorVest, Inc.
- Executive Premier Workshop
- One-Day Options Course
- OptionsPro
- Retirement Income Workshop
- Sure-Fire Trading Systems (VectorVest, Inc.)
- Trading as a Business Workshop
- VectorVest 7 EOD
- VectorVest 7 RealTime/IntraDay
- VectorVest AutoTester
- VectorVest Educational Services
- VectorVest OnLine
- VectorVest Options Analyzer
- VectorVest ProGraphics v6.0
- VectorVest ProTrader 7
- VectorVest RealTime Derby Tool
- VectorVest Simulator
- VectorVest Variator
- VectorVest Watchdog
